See new projection here.
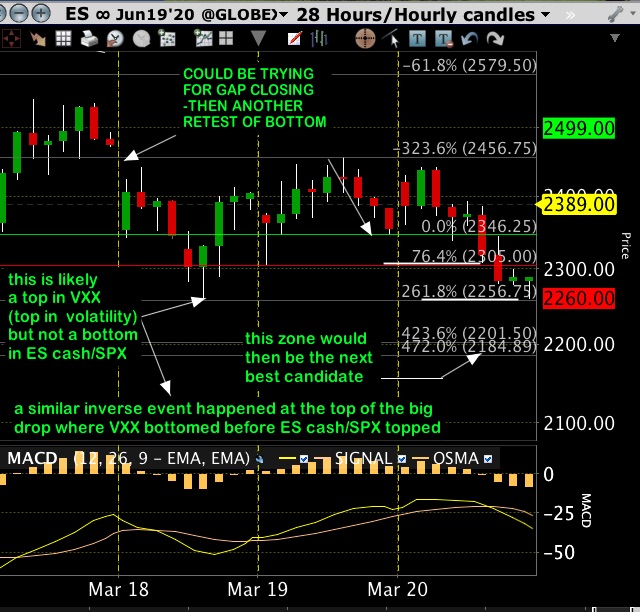
The after hours move looks like it wants to continue down next week perhaps after a small bounce. The reason and targets are described on the chart. All possibilities are still on the table but each week looks to bring us closer to the real bottom. The vector print on 3/18/20 still looks valid on thorough re-examination so the best fit is likely one that places the volatility as max'd out (VXX) on 3/18 with the S&P (market) yet to find it's low target price. Coincidentally, the top at 2/20/20 had volatility lows ahead of S&P highs in a similar relationship. This current (inverted) scenario could produce a notable up move whenever it does trip.
It sounds like a broken-record but those who were patiently watching with us when the top developed in almost the exact same way were ahead of the drop and were not taken by surprise (except perhaps by the jet-like speed of it). The market tells us daily and weekly. We have to read it correctly and pass it on as best we can. Note that 'BIG' continues to happen. Don't get caught on the wrong side or get wiped out. Please. There is quite enough going on already. Sleeping soundly will help keep your immune system in peak working order.
See Critical Long-Term Review Here

No comments:
Post a Comment