Sorry for all the 'investors' that are getting beaten down but the signs were written long ago about timing any mania. At least Tulips had flowers to look at and Beanie Babies had cute furry critters. Cryptos seem to grow under ground in an 'electric-energy mine' but have only dirt that holds them together. Big surprise if and when any of them go to zero.
As Follows- [note the 'english logic' -sounding explanations]:
"The Luna cryptocurrency is relaunching on a new blockchain, two weeks after playing a role in the collapse of the Terra blockchain.
The original Terra blockchain had two tokens, luna and stablecoin terraUSD (UST). Luna played a part in pegging UST to the US Dollar, but when UST lost its 1:1 pegging with the US fiat currency, the Terra algorithm began issuing more luna coins to rebalance the system. The hyperinflation caused luna to lose nearly all its value.
In what’s known as a ‘hard fork’, the new Terra chain will separate from the old Terra Classic chain. Terra’s native token will be luna, while Terra’s Classic’s will be luna classic.
Referred to as Terra 2.0 by the project’s creators, the new project will cast off the terraUSD (UST) stablecoin.
Previous luna and UST holders will receive new tokens via airdrop today (Friday 27 May). Those with more than 10,000 tokens will receive 30% now and the remaining 70% over two years to prevent another crash caused by sell-offs."
-Quote from Forbes Magazine. Can someone tell us what 'non-fungible' means from further down in this article? We are astounded by the incredulity of the speech grammar and made-up descriptors in attempts to give the crypto-verse real-world credibility [where many of us live]. The peddlers and promoters have made the biggest cash takings as always. Again. we sympathize with any and all caught up in the pursuit of profits without enough understanding of what they got into. Perhaps [like dot.com boom bust], a new and more meaningful product will be born later on from all the innovation the money infusion has begun.
From a year ago- [the picture below says it all with bitcoin prices at bottom of chart]- 'I got bit by bitcoin'- see article
This Information Is For Entertainment Purposes Only. Financial Loss Can Occur From Investing.
Our favorite go to site- McVerry Report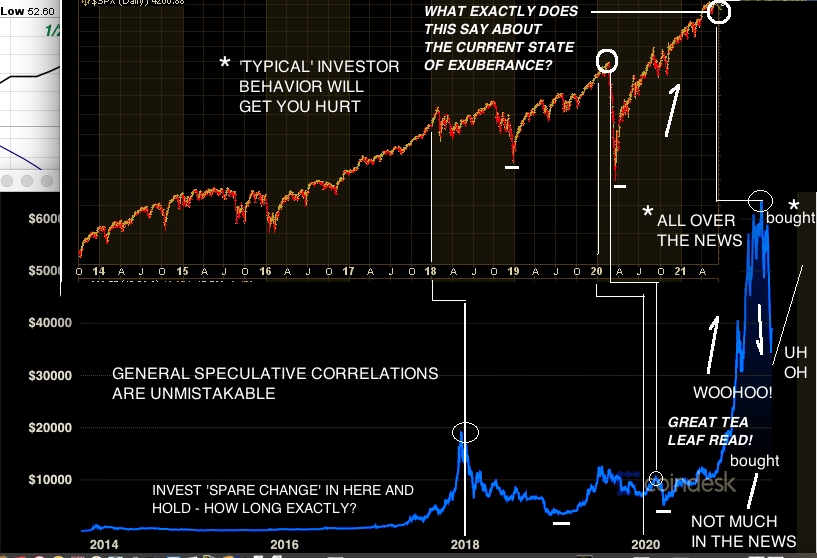


