Tuesday, June 29, 2021

These Three Things Are Required To Create A Top

EOD: Still waiting for what could be a wave 'v' up to complete. See this post.

"Are we there yet?" ah..yes..those famous words that betray impatient passengers. What does the sage say? .. Three things must ye see:

#1 Tail Down,
#2 VIX Up,
#3 Breadth Down.
[note the 200ma is down 26% from 11/11/2019 high and also has turned down 7.5% since 6/7/2021]

That's it apart from the micro-signals that we often can spot as they occur. Most likely headed for the 'Pivot' first.


See Critical Long-Term
UPDATED 4/12/2021 Review Here
The bots will flag here when they see a top. (1/25/202/20/204/9/20)
This Information Is For Entertainment Purposes Only. Financial Loss Can Occur From Investing.
Our favorite go to site- McVerry Report


Friday, June 25, 2021

Still Printing Inside a Wave 'v' Target Zone.. 6 Weeks & Counting

Chart at right is VXX. It also has a secondary target immediately below at the 28.76 price point. Possibly, that could coincide with wave 'v' top on this sub-leg. We also now have two deep weekly histogram bars on the NYAD weekly chart. Looking for 4 total or more so getting to be about half-way with that expectation.

See Critical Long-TermUPDATED 4/12/2021 Review Here
The bots will flag here when they see a top. (1/25/202/20/204/9/20)
This Information Is For Entertainment Purposes Only. Financial Loss Can Occur From Investing.
Our favorite go to site- McVerry Report


Does A Conclusion Match Historical Data?

We noticed that a theory is being offered as to why the current market situation will likely not be close to a major top.  The observation is that Vix futures 'open interest' needs to be well above it's 200ma. Using the chart that was offered to demonstrate this, we find potential inaccuracies with data alignments so we necessarily have to dismiss this theory as not being a reliable historical indicator. We do however agree that the observation does carry some merit when close to a very few tops but not enough to be useful. 

Aside from this and going one further, since the elevated level on the futures open interest 'print' above 200ma is promoted as being important- the implication is that the value on the 200ma also has significance BUT the 200ma took out the lows from 2016 as recently as this year and has made lower lows and lower highs since 2018.. hmm. IF it shoots up from here dramatically, we will stand corrected but it will need to be very dramatic.

See Critical Long-Term
UPDATED 4/12/2021 Review Here
The bots will flag here when they see a top. (1/25/202/20/204/9/20)
This Information Is For Entertainment Purposes Only. Financial Loss Can Occur From Investing.
Our favorite go to site- McVerry Report


Wednesday, June 23, 2021

What Do All Major Tops Have In Common Without Exception?

Answer: New all-time highs [more or less]

This does not mean that every new all-time high is a top. There are periods in the market when new all-time highs are printed consistently with little to no pullback. Think: a high degree wave 3 or a wave 5 particularly. The odds outside of a wave 3 go up marginally at first and then substantially when key extension levels are being hit [inside a fifth or concluding] wave together with declining breadth at the weekly level. Such is the possibility currently.

Cannot say his enough-
Look at the chart on the Dow progression. Quite possibly more to go on this last leg since the current move up from the low on 2009 appears to be a fifth wave in a 'nested' 1-2, [1]-[2], [3]-[4], 3-4, [5?] leg and wave 5 now exceeds wave 1 length which during a 'nested' leg often is limited on how far it will extend from here. Often wave 5 can equal or exceed wave 3 length in non-nested legs. In this case a potential wave 5 has now exceeded wave [3] [inside nested leg] but has not equaled the larger degree wave 3. If that were to be the ultimate target [a HUGE number on the Dow], it is doubtful it could achieve that easily without a completely new structure forming so we go with the more likely top being just around the corner. More breadth decline is required to accomplish this.

See Critical Long-TermUPDATED 4/12/2021 Review Here
The bots will flag here when they see a top. (1/25/202/20/204/9/20)
This Information Is For Entertainment Purposes Only. Financial Loss Can Occur From Investing.
Our favorite go to site- McVerry Report


Tuesday, June 22, 2021

What This 86-Year Cycle Alignment Might Be Suggesting

For further reading on the Pi cycle number theory development - see this article
Now look at the potential projection for the Dow and see if the overlay might be relevant at the highest degree.

The beginning process of a collapse in bullish volatility derivatives hardly seems coincidental over such a large time span.

No large top showing yet on this leg but after this next mini-pullback, there could be a doozy about to arrive.

See Critical Long-Term
UPDATED 4/12/2021 Review Here
The bots will flag here when they see a top. (1/25/202/20/204/9/20)
This Information Is For Entertainment Purposes Only. Financial Loss Can Occur From Investing.
Our favorite go to site- McVerry Report


Monday, June 21, 2021

Still Waiting For Fifth Wave To Hit Since 5/20/21

As per usual- apologies to EW technicians. Our use of labels is purely centered around fib extension progressions because it seems to work and removes potential ambiguous EW analysis. Most of the blog sphere seems to be chock-full with 'observations' of various movements. It can be difficult to see through the veil. A short term top is expected probably when VXX hits a new low and the market hits either a new high [wave 'v' ?] or a lower high. Expectation is for the decline [if and when that does occur] to take out the low from the one that began with a high around 5/10/21. Still not quite there but vector progress seems to be on target so far. Still no large degree top showing yet on this leg.

Weekly breadth MACD on NYSE (NYAD) trying to bounce from a low last week of -32 on the actual plot line. The red signal line is still positive and may need to get closer to zero on the weekly for the ST decline mentioned above to commence.

See Critical Long-Term
UPDATED 4/12/2021 Review Here
The bots will flag here when they see a top. (1/25/202/20/204/9/20)
This Information Is For Entertainment Purposes Only. Financial Loss Can Occur From Investing.
Our favorite go to site- McVerry Report


Saturday, June 19, 2021

How To Consolidate All The Major Signals That Are Showing

Update 6/21/2021 regarding potential timing window: Already looking at comparisons with the top on 2007 and now the top on 2000 may present another timing option. In the past, the calendar time period using the Pi constant [3.1416] has provided clues to event time windows. The top in 2020 hit a volatility derivative bottom prior to the SP-500 top exactly to the day[s] on a very long term projection using * Pi yrs projection.

The date for the top in 2000 when the SP-500 began it's decline proper was 8/28/2000 [weekly chart]. If we take 8/28/2000 [2000.75] and add 5 x half-cycles (8.6 x 0.5 = 4.3yrs), it calculates to 2022.25 so this presents another possibility for an event. If valid, the event could be a top or a bottom in the Dow, SP-500 or a top / bottom in volatility or a derivative [VXX] so we will be keeping that timing window in mind as we approach that date. Looking at the posts where a projection was estimated at 4 to 6 months, this could fit well with a top say 3 or 4 months prior to that window. Also, it could have minimal or no relevance at the half-cycle Pi year increment.


* Pi constant= 3.1416 and Pi cycle yr calendar-days: (8.6 x 365) / 3.1416 = 1000  +/-. This whole round number for Pi years has proven significant as does the half cycle increment [4.3 yrs] on occasion.

see post for 6/21/2021 here

Original post-
Best estimates using current conditions can change if prices suddenly and dramatically lurch up or down. We will re-analyze if that occurs. A small correction is expected to happen in the coming weeks likely to take out lows below the bottom prices from the decline beginning on May 10 2021 but no major top is showing using standard signal markers yet.

Some chatter regarding extended P/E ratios, margin debt levels, 'crash talk', bitcoin correlation with the market - all of those tea leaf type readings most of which are accurately portrayed but do not tell you when that convergence has any meaning. Markets will stay leveraged [overbought. diverging etc] until that critical tipping point is hit. THAT is determined by market participation ONLY. in fact, all of this chatter is a great contrarian signal that the market is NOT DONE short term. Whatever 'term' one is looking at as far as a time window. 

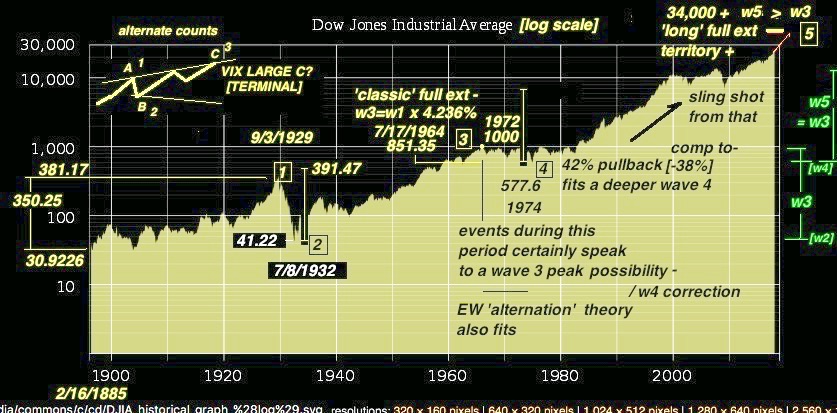
IF a major top [or series of tops] is building, we are inclined to look at events around 2007 at least as far as current conditions seem to be emulating. Readers of this blog will have seen all the lead up posts recently to describe in more detail how we got here in our estimation. For others, you can catch up on key prior posts shown lower down.

Market Breadth: [upper chart] Readers will be familiar with our continued references to advance-decline weekly charts simply because they historically have been a reliable benchmark for market potential price moves at critical points. Rough draft time estimate to a potential top from here = 4 months. Also- four total weekly [deep] histogram bars either intermittent or concurrent that also move the red signal line closer to zero, could put us into a pivot top zone.

Summation Index: [lower chart] An adjunct indicator to weekly breadth. Rough draft time estimate to a potential top from here = 6+ months.

It should also be noted that at the end of another 4 - 6 months, the chatter will likely not seem so impressive even though the leveraged nature of the market will likely be even greater. Top calling [crash talk] will probably have exhausted everybody.

post2

post1

See Critical Long-Term
UPDATED 4/12/2021 Review Here
The bots will flag here when they see a top. (1/25/202/20/204/9/20)
This Information Is For Entertainment Purposes Only. Financial Loss Can Occur From Investing.
Our favorite go to site- McVerry Report


Friday, June 18, 2021

Combined Bigger Picture Since 2000 - What It Might Be Telling Us

[see lower charts] If the expected top is currently under construction, it could take it into next year to create however, there may be little upside overall compared to market price advances so far. There will likely be occasions where price movement will offer opportunities short-term. If movement lurches deeply one way or the other before then, we will re-analyze at that time.

Commentary: a 500 point drop in the Dow is little more than a 'blip' but the media loves the hundred-fold numbers. Try saying loudly "1-1/2%" - the SP-500 can do that consistently down then back higher without even blinking. Let's stay real here. A correction somewhat larger than May 7-10 2021 'mini-top' is potentially expected but not there yet. Expect a very bumpy road into a top possibly any time between the coming weeks into early next year.

Dow summation index looks perilous going forward. See post- Dow Wave Progression Is Stretched


Checking current breadth looks like this prediction [if it closes near lows] - Weekly Breadth Is Floating In Thin Air

See Critical Long-Term
UPDATED 4/12/2021 Review Here
The bots will flag here when they see a top. (1/25/202/20/204/9/20)
This Information Is For Entertainment Purposes Only. Financial Loss Can Occur From Investing.
Our favorite go to site- McVerry Report


Thursday, June 17, 2021

Dow Wave Progression Is Stretched

Since it's inception, the Dow Industrials has now advanced to a point where it is showing potentially extended levels using wave assumptions and fib 'extension math'. The log scale can be difficult to implement when these sizes of move are in the rear view mirror so we gave it our closest scrutiny to keep it as close to numerically valid as possible. The alternate counts are also shown on the inset. Are we way off? Who knows.. we applied the same extension protocols we use consistently at lower degrees and we have relative success at those lower degrees. As far as we have been able to tell, the same logic scales upward as well as down in degree so we will have to watch closely, as always. If this is waves 1 through 5, we have seen wave 5's elongate on occasion but not beyond a certain point and that point could be approaching. Likely will be confusion based on the disconnects we see among the 'normal' parameters we use so staying focused on the basics will be key.

"VIX large 'C' [terminal]" comment refers to bottom mkt prices inside the formation wherever that may fall [megaphone center or wave 4 pullback if w1 thru 3 formation currently etc]. For VIX moves possibilities-.See previous post.

Also note that most often the Dow and the other indexes like SP-500 move somewhat disconnectedly and that certainly could occur in the scenario moving forward. Volatility will most likely be the common element which is why we like to devote special attention to the VIX and the volatility derivatives like VXX and SVXY.

See Critical Long-Term
 UPDATED 4/12/2021 Review Here
The bots will flag here when they see a top. (1/25/202/20/204/9/20)
This Information Is For Entertainment Purposes Only. Financial Loss Can Occur From Investing.
Our favorite go to site- McVerry Report

Correction: In the the chart "w3 = w1 x 4.236%" should read "w3 = w1 x 423.6% [using the top extension multiplier in the 'classic' protocol group].


Wednesday, June 16, 2021

If Vix Had A Multi-Year Bullish Plan: This Could Be It

11:35am EST: Declining breadth and several other signals are pointing to a slightly larger correction looming on the next new highs in the market. Expect potentially a larger correction than the one after the smallish top on 5/7/21 - 5/10/21. Perhaps twice that. Then off to new highs.

Original Post: [see chart]
Note that the highest degree labels would probably be more appropriately suited to some kind of flat, however; the lesser degree labels seem to be appropriate inside VIX [note that VIX only acts label-wise in smaller increments as it is a bounded quantity from it's creation and does not equate to prices like an equity so wave labelling is a mixture of subjective at the higher degree and more likely to be closer to accurate on the smaller scale].

The very large  'B' to 'C', if it materializes, will feel and be very unpleasant for anyone staying long during that period. All major corrections are distressing to the economy and any traders caught in the maelstrom. We do not wish it upon any of us but we have to consider the possibility. Only reporting the potential for a multi-generational event in the market that also includes the idea of better times coming out the other side.

Don't miss this post- Too Many Expecting A Major Correction Will Likely Have To Wait

See Critical Long-Term UPDATED 4/12/2021 Review Here
The bots will flag here when they see a top. (1/25/202/20/204/9/20)
This Information Is For Entertainment Purposes Only. Financial Loss Can Occur From Investing.
Our favorite go to site- McVerry Report


Tuesday, June 15, 2021

Too Many Expecting A Major Correction Will Likely Have To Wait

Readers of this blog know we are never afraid to go out on a limb if historical samples permit: Note that this is only one possibility of many:

Current status of the NYSE summation index chart curves looks premature regarding the likelihood of an imminent major top. Of course there may be 'scary bumps' before it gets there. The comparison with 2007 top is not a suggestion that the next top will be equivalent to it- just convenient as far as structural patterns and indicator curves.

See Critical Long-Term
 UPDATED 4/12/2021 Review Here
The bots will flag here when they see a top. (1/25/202/20/204/9/20)
This Information Is For Entertainment Purposes Only. Financial Loss Can Occur From Investing.
Our favorite go to site- McVerry Report


Monday, June 14, 2021

Summation Index 'Delay-Pattern' Right On Target

Note that caution is warrantied even around this apparent delay. See prior post.

See Critical Long-Term
 UPDATED 4/12/2021 Review Here
The bots will flag here when they see a top. (1/25/202/20/204/9/20)
This Information Is For Entertainment Purposes Only. Financial Loss Can Occur From Investing.
Our favorite go to site- McVerry Report


Friday, June 11, 2021

Weekly Breadth Is Floating In Thin 'Air'

EOD: Took all hands to the pump to spike breadth at the close and just closed below the signal line [barely]. This is a very interesting pattern everywhere at the moment. It's going to be one for the books most likely when it does finally break.

2:30pm EST:
 Volume has dropped to almost nothing on ES futures. Very odd. Cannot see a day with volume this low for a long way back. Perhaps our data feed is mis-reporting. ES 4230.75 measures as a wave iii down so that's possibly all she wrote for today. Once it takes out 4241.50 to the upside most likely off to higher highs.

1:37pm EST: The only thing that is happening is more air being blown under the breadth MACD weekly plot although it is attempting to cross down over the signal line. It would be no big surprise to see it reverse from that course into the close today and finish above the signal line. Hard to say when that is going to change. Vix is hitting new lows but no other signals so far.

NYAD weekly MACD  looking very odd. Historically the only recent structure similar is in late 2007. Volatility derivative VXX  is only a few points above a classic high degree nominal target zone 1 [3 more are possible-all lower] so this could get interesting quite soon. Explanation: the rectangles are drawn between the weekly NYAD MACD plot line and the general tops of the histogram bars. Most often these gaps do not persist for this amount of time and suggest not much holding up the plot line. Of course, it can float just as long as buyers support it but when it does break, it could be mild or quite dramatic to the downside. No terminal top yet.

See Critical Long-Term
 UPDATED 4/12/2021 Review Here
The bots will flag here when they see a top. (1/25/202/20/204/9/20)
This Information Is For Entertainment Purposes Only. Financial Loss Can Occur From Investing.
Our favorite go to site- McVerry Report


Thursday, June 10, 2021

Volatility Derivative VXX One More Target

Confidence on this next target on VXX is some better as we now have 3 separate projection criteria pointing to the same zone at 31.60. Next lower is at a higher degree at 29.95 zone.- that will be hit at some point.

See Critical Long-Term
 UPDATED 4/12/2021 Review Here
The bots will flag here when they see a top. (1/25/202/20/204/9/20)
This Information Is For Entertainment Purposes Only. Financial Loss Can Occur From Investing.
Our favorite go to site- McVerry Report


Wednesday, June 9, 2021

Weekly Vix Closings Pattern May Be Saying Something To Support A Pivot Top Approaching

"VXX hit a 'classic' extension lower at 32.80/[32.51-next]" - 32.51 is holding so far and breadth looks to be peaking so we will have to see what breaks first. ES 4242.50 was a potential next higher target.

See Critical Long-Term
 UPDATED 4/12/2021 Review Here
The bots will flag here when they see a top. (1/25/202/20/204/9/20)
This Information Is For Entertainment Purposes Only. Financial Loss Can Occur From Investing.
Our favorite go to site- McVerry Report


Monday, June 7, 2021

Wave ' v ' Yet To Confirm

3:40pm EST: VXX hit a 'classic' extension lower at 32.80/[32.51-next] zone fib calculation so let's see how the next session[s] behave. Breadth is looking less than stellar today. Going forward, if VIX takes out the closing low from 4/16/21 [16.25] then we are back to a reset as far as any immediate pull back outlook.

2:10pm EST:
 If wave 'iv' has completed where plotted, wave 'v' has only progressed three waves up. In this market particularly, fifth waves have been erratic about half the time not necessarily fully completing five sub-wave moves. Sometimes they have retraced down almost taking out the first wave of leg ['i'] before starting a new thrust to create a new leg up that does achieve the originally intended target zone from the prior failed leg. Still no terminal top in this market. VXX did hit a lower target at 33.07 zone.

Original post:
Wave 'iv' took almost two calendar weeks if it has completed. Not exactly impressive but market has more upside to run.

Commentary: Blogger's and even analyst's 'opinions' are exactly that unless accompanied by demonstrable data. Even at VectorSpike. The ONLY thing that matters is what exactly is happening with data patterns at large and small degrees. It can be quite complex and can take a huge amount of disciplined 'work' to even come close to accurate signal deciphering otherwise everybody would be doing it and profiting and no matter what the press would have you believe- it isn't get rich quick even though some do but check back with them in 10 years to see if they use a process or if it was coincident timing. Even winners in Vegas often end up giving their winnings back to the house. Some find another way when they need real results even if it is more work and less exciting.

See Critical Long-Term UPDATED 4/12/2021 Review Here
The bots will flag here when they see a top. (1/25/202/20/204/9/20)
This Information Is For Entertainment Purposes Only. Financial Loss Can Occur From Investing.
Our favorite go to site- McVerry Report


Saturday, June 5, 2021

Close Similarities To 2007 Pre-Top

VXX at 33.25 is close enough to the target. This was a new low for VXX while ES cash did not really pierce the high zone so we shall see if a decline commences sometime soon. Weekly breadth kissed the red signal line which is about as close as it has come for 9 weeks so that could be a set up. Not a terminal top yet and the pre-topping action [pivot?] most likely will not be as dramatic as in 2007. Mostly the chart demonstrates the positional possibilities given the advancement of the market currently in prices and the proximity to high degree vector targets [currently approximately 10% to 15% above a volatility derivative low- first draft target zone from 3/23/2020]. Mid-section of the chart shows nyad weekly 50ma and 200ma plots. Upper section shows SP-500. Also note- in both cases the nyse summation index 50ma is demonstrating peak behavior. Not quite there yet.

See Critical Long-Term
 UPDATED 4/12/2021 Review Here
The bots will flag here when they see a top. (1/25/202/20/204/9/20)
This Information Is For Entertainment Purposes Only. Financial Loss Can Occur From Investing.
Our favorite go to site- McVerry Report


Friday, June 4, 2021

If VXX Low Holds Through Next Two Sessions..

EOD: VXX at 33.25 is close enough to the target. This was a new low for VXX while ES cash did not really pierce the high zone so we shall see if a decline commences sometime soon. Weekly breadth kissed the red signal line which is about as close as it has come for 9 weeks so that could be a set up.

1:09pm EST:
 Could be generating 'micro-targets' now we see those arriving at 33.26 and 32.80 and 32.05. Those are targets generated with very small vectors beginning yesterday. An unusual but not improbable scenario especially when you are in a general higher degree target zone. We will know more in the next few sessions.

12:30pm EST: There is a new slightly lower VXX extension calculation at 33.38 zone so it may i) spend some time there or ii) move lower at the close on it's way down to the next new target.

Several vectors are signaling a modest decline could begin soon and thwart this short-term leg. Not a terminal top yet.

For several weeks now- week-ending has seen a majority of buy-ins so today should be a good test of VXX lows. Having said that- only 3 out of the last 9 consecutive weeks have been positive over the previous one on the NYAD MACD but the overall status of breadth is at an elevated level so anybody's guess on what comes next. VXX low is at a measured position so it needs to hold otherwise, a new target will have to be calculated [market goes higher].

See Critical Long-Term
 UPDATED 4/12/2021 Review Here
The bots will flag here when they see a top. (1/25/202/20/204/9/20)
This Information Is For Entertainment Purposes Only. Financial Loss Can Occur From Investing.
Our favorite go to site- McVerry Report