Saturday, November 28, 2020

Revisiting The Huge 'Tell' In These Critical Charts!

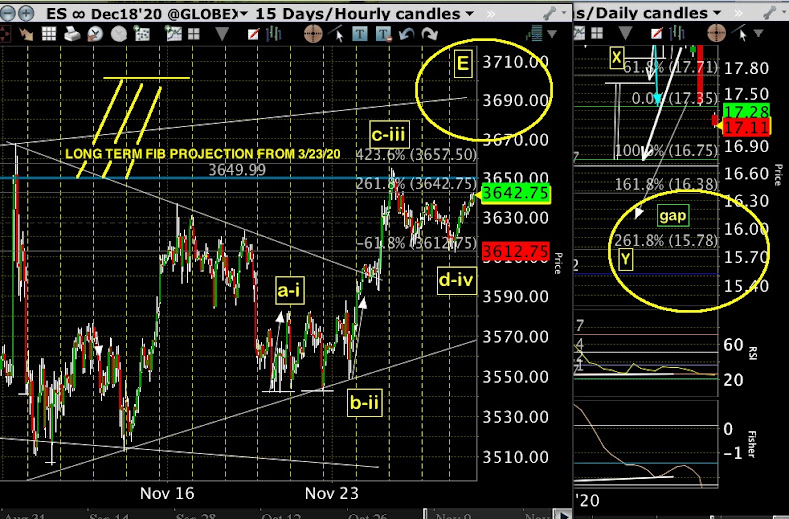
-Updated pre-open 11/30/20: looks like ES 3655 price zone still offering resistance to penetration. It may or may not be penetrated prior to the next partial pullback. Watching VXX target for that to hit which could provide the tipping point zone to become engaged. ES 3589 (overnight) could be a wave 'd-iv' down pullback area. Wave 'e-v' up may occur next unless a new leg requires to launch from even lower down.

-for a close up of price action- see previous post here.

We are expecting the next 'partial' pullback to occur by year-end
. Most likely there needs to be higher cash market prices than the recent highs prior to this next pullback but they aren't required as we are at a significant resistance zone in SP-500 and also at a notable support zone in VXX leveraged volatility derivative. The December time-frame may be significant. The pullback will probably spook most and may look like the 'crash' many seem to be calling for. We do not see that yet in the medium-term outlook but we stay open to recalculate based on reality as it happens.

Longer-Term Outlook:
Historical comparison with the current situation and that in 2015, there is a very real possibility that we are approaching a critical juncture in the market. As any higher degree price move requires time to develop longer than 'normal', it could be happening over a large time window with many twists and turns yet to come. VectorSpike will continue to monitor and report.

Even with this outlook- there may yet be higher all-time highs in the general market before the highest degree top occurs. That may well occur after the next anticipated pullback which may not take out the March 2020 low in SP-500 (although SVXY may go lower). SVXY may continue to print lower highs and lower lows relative to it's 2018 price range.

See Critical Long-Term Review Here
The bots will flag here when they see a top. (1/25/202/20/204/9/20)
This Information Is For Entertainment Purposes Only. Financial Loss Can Occur From Investing.
Our favorite go to site- McVerry Report

NOT A RECOMMENDATION TO TRADE- FOR ENTERTAINMENT PURPOSES ONLY!
Is SVXY Giving us a huge red flag? (note that this structure is still developing and may morph any number of times). 
-even with the adjustments to how SVXY price is computed in 2018, the magnitude of these moves warrants attention.


Friday, November 27, 2020

More Upside To Target Zone

Continuation of current uptrend towards significant targets. This top will likely not be the market's final 'Grand Super-Cycle' top just yet even though it looks high. Could be a wave iv top on SVXY followed by a wave v-down and then a likely huge bounce back up more likely to be that particular top. Keep watching. ES 3650 has the potential to resist an easy penetration. So far that looks to be what has occurred.

Watching for hits in the ES and VXX target zones towards creating a top.

Note the RSI(upper)/Fisher(lower) indicators on VXX daily are printing a consistently rising positive divergence and have been since early August 2020. Together with the geometry shown in ES, this could be indicating a bearish conclusion somewhere close.

See Critical Long-Term Review Here
The bots will flag here when they see a top. (1/25/202/20/204/9/20)
This Information Is For Entertainment Purposes Only. Financial Loss Can Occur From Investing.
Our favorite go to site- McVerry Report


Wednesday, November 25, 2020

Daily Long Term Target 'E' (Breakout)

News headlines can fake anyone in either direction which is why the larger pattern analysis is the more sane and reliable pointer to minimize surprises:

Watching for hits in the ES and VXX target zones towards creating a top.

Note the RSI(upper)/Fisher(lower) indicators on VXX daily are printing a consistently rising positive divergence and have been since early August 2020. Together with the geometry shown in ES, this could be indicating a bearish conclusion somewhere close.

See Critical Long-Term Review Here
The bots will flag here when they see a top. (1/25/202/20/204/9/20)
This Information Is For Entertainment Purposes Only. Financial Loss Can Occur From Investing.
Our favorite go to site- McVerry Report


Tuesday, November 24, 2020

Wave 'C' Down May Not Be Complete

Update: 11:12am EST: As anticipated in a previous post (lower chart- triangle), ES is attempting to break out above the triangle trend line currently drawn. Caution is advised. Looks like red 'c' down did complete after all. Ultimately higher market prices are in play as expected per the chart.

Vaccine 'hype' - while it is positive news, trading goes on between market participants not vaccinators necessarily. Seems like any news event is made to 'fit' an up or down in the market- it's a distraction from reality patterns. Sometimes they coincide but the odds are not reliable. We look at a host of current pattern developments and how they fit historical precedents and adjust accordingly, that usually reduces surprises to a minimum.

Watching for hits in the ES and VXX target zones to create an intermediate top.
-could be more down prior to that occurrence.(wave C)

Note the RSI(upper)/Fisher(lower) indicators on VXX daily are printing a consistently rising positive divergence and have been for a few weeks now. See previous post.

See Critical Long-Term Review Here
The bots will flag here when they see a top. (1/25/202/20/204/9/20)
This Information Is For Entertainment Purposes Only. Financial Loss Can Occur From Investing.
Our favorite go to site- McVerry Report

Monday, November 23, 2020

Another Small 5 Waves Up- But Looking for 'C'-Wave Down Completion

EOD: The option for a 'c' to print lower is still very much in play.

Watching for hits in the ES and VXX target zones to create an intermediate top.
-could be more down prior to that occurrence.

Note the RSI(upper)/Fisher(lower) indicators on VXX daily are printing a consistently rising positive divergence and have been for a few weeks now. See previous post.

See Critical Long-Term Review Here
The bots will flag here when they see a top. (1/25/202/20/204/9/20)
This Information Is For Entertainment Purposes Only. Financial Loss Can Occur From Investing.
Our favorite go to site- McVerry Report

Saturday, November 21, 2020

Week Ending Signals - Moves Still In Play

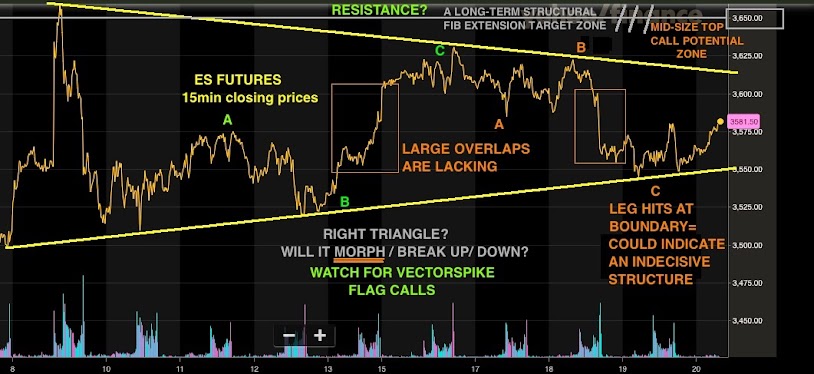
With Friday's down-print- 9 out of the last 12 weeks have printed a down value on the weekly breadth ($NYAD) MACD however, it has been a very gradual moving average signal decline so far. The bottom chart (long right triangle) print continues...note that the closing price down move hits the lower trend line- it may bounce back up or push on the lower trend line.

Watching for hits in the ES and VXX target zones to create an intermediate top.

Lower Chart: May not be what it looks like- it could break partly up and trap a few. However, it may well still be 'under construction'. Don't forget- on SVXY the wave iv up may still be in play and it has now stuck it's head up and is printing new wave iv highs.(wave v down may be pending). 

Note the RSI(upper)/Fisher(lower) indicators on VXX daily are printing a consistently rising positive divergence and have been for a few weeks now.

See Critical Long-Term Review Here
The bots will flag here when they see a top. (1/25/202/20/204/9/20)
This Information Is For Entertainment Purposes Only. Financial Loss Can Occur From Investing.
Our favorite go to site- McVerry Report

Friday, November 20, 2020

Two Week Long Right Triangle Now In Play

EOD: With today's down-print- 9 out of the last 12 weeks have printed a down value on the weekly breadth ($NYAD) MACD however, it has been a very gradual moving average signal decline so far. The bottom chart (long right triangle) print continues...
Update: 1:10pm EST: We are passing an intraday 'Pi time' interval, so there could be movement forthcoming. ES 3582 measures as a small wave iii-up from 'b' zone (yellow square) and could be printing a small iv-down now.(5-min candles). Either that or it is done at small wave iii-up.

Lower Chart: May not be what it looks like- it could break partly up and trap a few. However, it may well still be 'under construction' so let's see what the week-end in the market gifts us as far as this structure. We are also looking at weekly breadth numbers. Don't forget- on SVXY the wave iv up may still be in play and it has now stuck it's head up and is printing new wave iv highs.(wave v down may be pending)

See Critical Long-Term Review Here
The bots will flag here when they see a top. (1/25/202/20/204/9/20)
This Information Is For Entertainment Purposes Only. Financial Loss Can Occur From Investing.
Our favorite go to site- McVerry Report


Thursday, November 19, 2020

Right Triangle Breakdown?- Confirmation Targets

As mentioned in prior post- looks like a potential price breakdown attempt. Need confirmation in VXX- it would look better if the lower target vector was hit before accelerating but it isn't required.

Note that VXX indicators (upper RSI, lower Fisher) on the daily may be getting closer to creating a positive divergence.

See Critical Long-Term Review Here
The bots will flag here when they see a top. (1/25/202/20/204/9/20)
This Information Is For Entertainment Purposes Only. Financial Loss Can Occur From Investing.
Our favorite go to site- McVerry Report

Wednesday, November 18, 2020

Looks Like A Short-Term Leg Approaching A Juncture

item 1) ES 3650.00 measures as a potential critical long-term price zone.

item 2) 'a-b-c' up measures to a fib calculation at 'c' (yellow boxes)

item 3) VXX has vectors indicating it could be closing in on a lower target.

See Critical Long-Term Review Here
The bots will flag here when they see a top. (1/25/202/20/204/9/20)
This Information Is For Entertainment Purposes Only. Financial Loss Can Occur From Investing.
Our favorite go to site- McVerry Report


Monday, November 16, 2020

Nested Waves Up To [iii] + More Targets.

Could be a [iii] up completed.

See Critical Long-Term Review Here
The bots will flag here when they see a top. (1/25/202/20/209/4/20)
This Information Is For Entertainment Purposes Only. Financial Loss Can Occur From Investing.
Our favorite go to site- McVerry Report

Saturday, November 14, 2020

Always Bullish Into A Potential Top (Projection Targets)

Update 11/16/20 12:35pm EST: Looks like the wave [iii] target zone is in play on a nice continuation of the breadth thrust that commenced 11/13 (b - c leg up). Let's see if this wave 'parks' itself somewhere prior to a wave [iv] pullback or if it continues straight up as in a 3 waves-up leg

The following three charts give us an excellent guide to the current projection: Clue- bullish to target but if an SVXY wave 'iv' up, could be a reversal pending.

$VIX has not turned flat/positive yet- bullish implication. (bottom chart used to flag potential tops)

See Critical Long-Term Review Here
The bots will flag here when they see a top. (1/25/202/20/209/4/20)
This Information Is For Entertainment Purposes Only. Financial Loss Can Occur From Investing.
Our favorite go to site- McVerry Report


Friday, November 13, 2020

End Game Countdown For This Leg

Update 3:30pm EST: The structure now better fits i-v down ('v' where the red 'iii' down shows currently) and then an a-b-(c) up with 'c' underway and a potential to hit the 3600 zone. We will post the updated chart after the close. Could be a nice set up for a down move to initiate beginning next week.

Update 1:30pm EST: Potential contracting triangle right shoulder (from 11/10) could break either way but there are vectors indicating a potential down move. (most likely not the end of the larger leg up)

Looking for a divergence to persist over a week or two for prices vs breadth while targets are in focus.

Medium Term: 
:
The controlling structure may be i-ii-iii-waves down on SVXY with wave iv/d up showing nowSee related post
-(update note: SVXY has now entered wave iv/d upper price zone territory @40.25)

See Critical Long-Term Review Here
The bots will flag here when they see a top. (1/25/202/20/209/4/20)
This Information Is For Entertainment Purposes Only. Financial Loss Can Occur From Investing.
Our favorite go to site- McVerry Report

Wednesday, November 11, 2020

Small 3 Waves Down So Far

Small i-ii-iii down intraday.
VXX vs VIX plot has shown to be an interesting market gauge recently. The original layout from 11/7/20 is presented together with the current status. While we are not quite there yet, it appears to be presenting as was anticipated. It was not expected to be an identical copy of the previous pattern circled but generally should print similar sequences. Other charts will be used to call the final market top hit price zone. 

Medium Term: :
The controlling structure may be i-ii-iii-waves down on SVXY with wave iv/d up showing nowSee related post
-(update note: SVXY has now entered wave iv/d upper price zone territory @40.25)

See Critical Long-Term Review Here
The bots will flag here when they see a top. (1/25/202/20/209/4/20)
This Information Is For Entertainment Purposes Only. Financial Loss Can Occur From Investing.
Our favorite go to site- McVerry Report


Tuesday, November 10, 2020

Expanding Triangle (Megaphone) Target Price Layout

Could be a megaphone-style expanding triangle. We have seen this type of structure used to create tops before. Regardless of whether that structure confirms or not, the indications for a short-term pullback seem to have presented.

-Sorry, not a 'vaccine rally' (as great as that news is). These structural targets have been on the projection layouts since the post on 10/12/20. Market correlations with news cycles is not supported under scrutiny whereas data-driven patterns are.

Medium Term: :
The controlling structure may be i-ii-iii-waves down on SVXY with wave iv/d up showing nowSee related post
-(update note: SVXY has now entered wave iv/d upper price zone territory @40.25)

See Critical Long-Term Review Here
The bots will flag here when they see a top. (1/25/202/20/209/4/20)
This Information Is For Entertainment Purposes Only. Financial Loss Can Occur From Investing.
Our favorite go to site- McVerry Report

Monday, November 9, 2020

Leg Up From 10/30/20 Targets

Update:2:24pm EST: Could be getting ready for the final approach as the say when flying. If we are close to printing a top as we project, then a 'sling shot' set-up move may be how it occurs - these require a nice 'pullback' first. That may be underway currently or about to transpire. They are not required for a top to print however- just one to be aware of so you don't get caught inside it.

Update:12:13pm EST:  ES 3668.00 has the potential for a larger retrace back down according to the math we are seeing but most likely may not be the final top. 
-The pullback so far to the 3588 zone on the 5 min chart looks like a pullback either a small 'a' or '1' down as it has five internal waves. There are gaps up that could be filled before we get a final top.
-Also the pullback to 3588 zone this morning equates to -2.24% for a wave a/1 down if the wave label sticks.

Update:11:16am EST:  (Dec 18 futures) ES 3668.00 is a fib extension target zone (fib +2.6) measured from the low on 11/6/20, ES 3454.75 (fib -3.2). ES 3454.75 is potentially a (yellow square) 'iv' pullback. 3668 would not however, likely be the final top. 

Update:10:37pm EST: Market tops (ones greater than short-term) come on a surge of optimism and at record levels. Check back as we are watching the moves much more closely now. The process looks to be underway.

No. it is not the election- but it is the leg up from 10/30 we have had continually on the radar. It has yet to complete.

Medium Term:
The controlling structure may be a medium degree wave 4 up about to complete after this leg bounces 
back up to a new high on ES and on *SVXY- See related post

See Critical Long-Term Review Here
The bots will flag here when they see a top. (1/25/202/20/209/4/20)
This Information Is For Entertainment Purposes Only. Financial Loss Can Occur From Investing.
Our favorite go to site- McVerry Report

VXX will soon be closing in on it's ultimate target lower:


Saturday, November 7, 2020

Another Chart With A Second 'Tell'

At VectorSpike we continue to produce some of the most strange approaches to projections that seem to work out for the most part. We are not that 'clever' really - we employ historical samples from many sources and all the work done by talented individuals in the area of chart analysis throughout market history that have gone before. They are the talent that gave us the tools for insight.

This one supports volatility expectations so perhaps there is a little bias but we do use several tools- too many to list every time but we think you have seen an example of most every approach we use to assimilate market analysis. 

Reference the chart #1 below:

The general take-away is that VIX is making higher strikes while VXX is doing the opposite- creating a diverging pattern in the relationship. The current market set up will not produce an exact replication comparing Feb 2020 and now but the basic premise should hold true. Stay with us for the call on the final flag signal.

A-  VIX expanding triangle
B-  VXX moving lower
C-  VXX MACD moving higher 
D-  VIX makes higher highs

Chart #2:
Weekly Advance-Decline (NYAD) MACD vs SP-500

Medium Term:
The controlling structure may be a medium degree wave 4 up about to complete after this leg bounces 
back up to a new high on ES and on *SVXY- See related post

See Critical Long-Term Review Here
The bots will flag here when they see a top. (1/25/202/20/209/4/20)
This Information Is For Entertainment Purposes Only. Financial Loss Can Occur From Investing.
Our favorite go to site- McVerry Report

VXX could breach 45.00 target price zone but should top out and then return to new lows:


Friday, November 6, 2020

Looks Strongly Like Waves (i-ii-iii) Up Are Close To Completion.

EOD: VXX is sitting at lower targets pending a final low. Breadth did finish with a small weekly negative signal so that is useful going forward to producing a top. Any market pullback from here will most likely be modest relatively speaking but may produce more negative breadth as some more is going to be needed to make the top we are expecting to print later on.

Update: 1:15pm EST: VIX is feeling the crush as VXX goes into it's lower target 2 zone. Breadth looks to be declining so far but we will have to wait for the close. A weekly number pointing down on the NYAD MACD (signal parameter) will build a negative divergence versus higher market daily closings to assist in creating a top.

Finally looks very much like we're getting into upward impulses needed to finish this leg off.

Remember:
The controlling structure may be a medium degree wave 4 up about to complete after this leg bounces 
back up to a new high on ES and on *SVXY- See related post

See Critical Long-Term Review Here
The bots will flag here when they see a top. (1/25/202/20/209/4/20)
This Information Is For Entertainment Purposes Only. Financial Loss Can Occur From Investing.
Our favorite go to site- McVerry Report


Thursday, November 5, 2020

Projection To New All-Time Highs But Watch Out.

Update: 3:31pm EST:  A reasonably large acceleration in breadth is not producing equitable market impact relatively speaking so we will see what the week-end closing brings us tomorrow.

Sorry- the market DOES NOT CARE who gets to sit at the top of the government pile, it only cares about heavy cash-laden investors ready for action TODAY no matter how they got here. Traders are buying and selling to each other in the auction yard. That is the only action we focus on.

Update: 10:00am EST: VXX 21.38 zone may produce a reaction. 

Remember:
The controlling structure may be a medium degree wave 4 up about to complete after this leg bounces 
back up to a new high on ES and on *SVXY- See related post

Note the 'gap' at 'D' above the trend line which suggests an up-leg that will take out the upper complimentary trend line as projected. It did not double-back to hit the trend line and that is often telling.

The roughly-drafted trend lines describe a medium-term contracting triangle about to be broken to the upside. Will ES retrace down from that trend line zone prior to reaching the final highs? Possibly.

See Critical Long-Term Review Here
The bots will flag here when they see a top. (1/25/202/20/209/4/20)
This Information Is For Entertainment Purposes Only. Financial Loss Can Occur From Investing.
Our favorite go to site- McVerry Report

Wednesday, November 4, 2020

3 Down- 3 Up Projection

Overlapping up/down but overall market is headed up for now. VXX has lower targets (20.67), once hit, then likely off to new highs in VXX as the overall market declines short-term from there ('E' ? or higher). Potential for VXX to close higher gaps is real before hitting the final low.

The controlling structure may be a medium degree wave 4 up about to complete after this leg bounces back up to a new high on ES and on *SVXY- See related post

See Critical Long-Term Review Here
The bots will flag here when they see a top. (1/25/202/20/209/4/20)
This Information Is For Entertainment Purposes Only. Financial Loss Can Occur From Investing.
Our favorite go to site- McVerry Report

Tuesday, November 3, 2020

Retrace Continues To 'iii' Of Wave 'D' Up- ALT: NEW LEG UP

Update 10:48am:  Looks like a potential new leg up with 'C' being the take-off point.

The controlling structure may be a medium degree wave 4 up about to complete after this leg bounces back up to a new high on ES and on *SVXY- See related post

See Critical Long-Term Review Here
The bots will flag here when they see a top. (1/25/202/20/209/4/20)
This Information Is For Entertainment Purposes Only. Financial Loss Can Occur From Investing.
Our favorite go to site- McVerry Report


Monday, November 2, 2020

Downside Targets, Overlaps And Gaps Oh My!

EOD: More small ES moves up to 'D' (lower VXX possible to 24.00 gap zone).

No- we aren't following a yellow brick road aka Oz fantasy but we are watching the arrow impulses and supporting vectors. So far a very interesting 'exercise' time-wise. VXX still has higher targets pending so until they are definitely nixed one way or the other, (either hit or a dramatic reversal of VXX down), we remain focused on the market downside targets and structure for now.

There could have developed a relatively narrow expanding triangle in VXX that will get us a reversal to a new market high once it's upper targets are hit. This would fit with the previous post projection estimates.

The controlling structure may be a medium degree wave 4 up about to complete after this leg bounces back up to a new high on ES and on *SVXY- See related post

See Critical Long-Term Review Here
The bots will flag here when they see a top. (1/25/202/20/209/4/20)
This Information Is For Entertainment Purposes Only. Financial Loss Can Occur From Investing.
Our favorite go to site- McVerry Report