Friday, October 29, 2021

Volatility Oversold Ratio Flashed

EOD: The targets for 'c/3' are still valid. Breadth today was another weekly negative which keeps adding to the negative divergence. Total is now 20 weeks of NYAD weekly MACD negative red signal with only 3 of those weeks showing a small positive histogram bar. This is an unusually large print of negative breadth!

Original post:
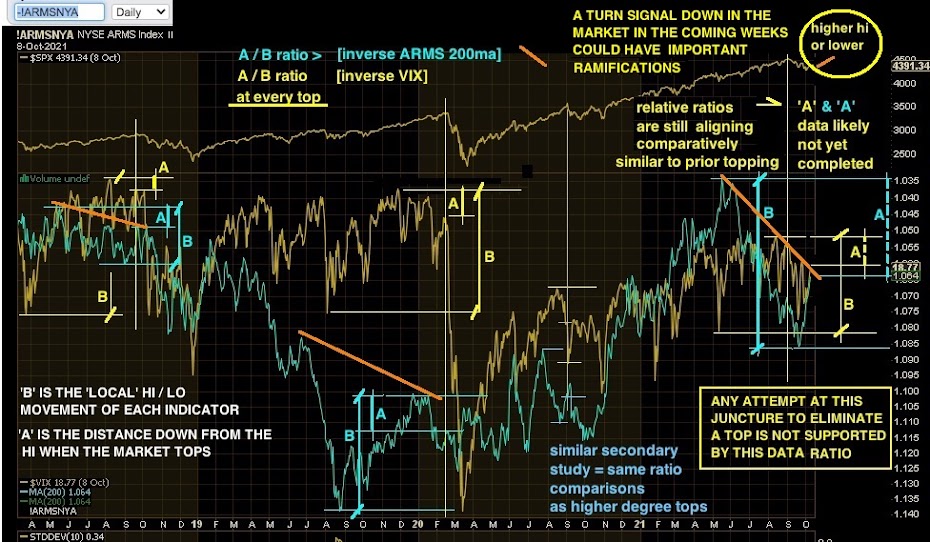
This same signal appeared on 9/1/21 just prior to the decline '[a] thru [e]' shown. At this juncture in the market a top, when it prints, could produce a mid-size pullback or more.


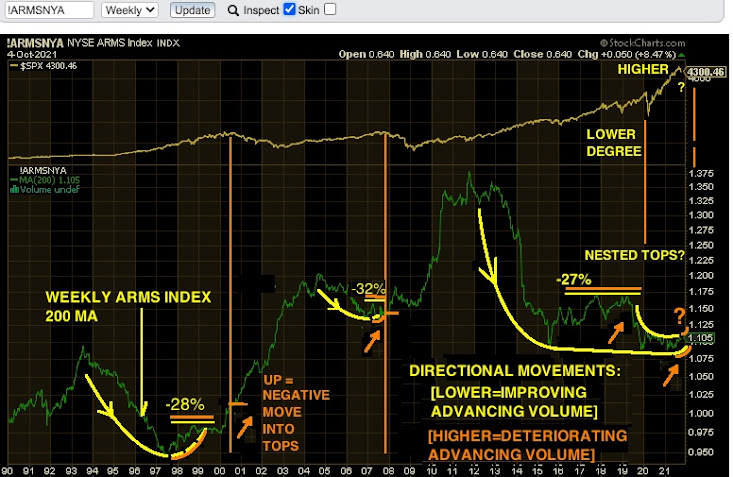
lower chart: here's what was posted back in Sept. '21: note the purple line extension where wave 'v' = wave 'iii'. The market has entered this particular zone and is definitely flashing amber. A target time frame anywhere between now and 11/5/21 thru 11/9/21 needs to be watched for a decline at some degree.

Comment: once again, so many 'headlines' as reasons for market moves.  If that were true, how do the technical signals often project likely directional changes before the news 'breaks'? Volatility oversold at the close because of negative news the following day does not add up logically. The cause-effect correlation is not that simply applied. Markets move exactly as they ought to propelling the 'ship' along and business responds in many different ways- not the other way around.

The bots will flag here when they see a top. (1/25/202/20/20)
This Information Is For Entertainment Purposes Only. Financial Loss Can Occur From Investing.
Our favorite go to site- McVerry Report


Thursday, October 28, 2021

Potential Precursor Signal Showed Up On The Daily

See prior post from 9/1/21
-note the target extensions from that post. The market has made very hard work getting here. The leg that began from late June is still to complete per the extensions shown back then.

There are many ambiguous signals occurring so staying focused on actual data numbers is important. VXX hit a 1.17 relative ratio [over-bought] value today at the close which previously has flagged a pending top. The typical basis value is 0.50 +/- so 1.17 is highly elevated. This particular parameter [see chart] has shown up on other occasions and is often an indication that the market 'heat' is hitting extremes. Also- it seems that many initial offerings are going exponential overnight so the feeding frenzy continues at least until the bids dry up.

A turn up signal in volatility could have significance in the next week or so. The early to mid November time widow is on the radar for a potential turn up in volatility based on a special 'half-span' progressive time calculation. It remains to be seen if this next estimate hits somewhere between now and early November. A possible double-hybrid time window projection is also a potential pattern with the smaller target very soon and a larger one to come as noted below. [This may fit in with the expected large degree top yet to come as a more complex long-term pattern is likely with a high degree terminal top]

Update: there may be two additional [larger degree] targets to the November time frame target as it looks like an inversion spike may have printed on the 'half-span' basis wave used to calculate the projected date. The first alternate takes it out to early December [12/6/21] and the second even later than that into early 2022 [1/15/22] which does seem possible given some other patterns. However- remaining flexible on these targets while relying on turn signals inside daily criteria to ultimately decide directional changes.

The bots will flag here when they see a top. (1/25/202/20/20)
This Information Is For Entertainment Purposes Only. Financial Loss Can Occur From Investing.
Our favorite go to site- McVerry Report


and here's what was posted back in Sept. '21: note the purple line extension where wave 'v' = wave 'iii'. The market has entered this particular zone and is definitely flashing amber.


Sunday, October 24, 2021

Watching This Space

MACD indicators on some supporting criteria need to roll-over so that leaves the time alignment in question on that basis. Prices, particularly in volatility instruments may stay range-bound while main indexes print potential small degree tops. Either way, a respectable sized turn signal print may imply a decline move to May '21 prices described. A terminal move later on is the next likely event.

The bots will flag here when they see a top. (1/25/202/20/20)
This Information Is For Entertainment Purposes Only. Financial Loss Can Occur From Investing.
Our favorite go to site- McVerry Report


Friday, October 22, 2021

Volatility Instruments Declining With Breadth - Look Out!

EOD: VXX squeezed a few cents lower and breadth reversed intra-day and finished only slightly positive but broke lower on it's MACD below the daily 'red' signal parameter. The weekly breadth has been below the red signal parameter for 7 consecutive weeks and printed a total parameter sum of negative [-]251 today at the close. There is not much more room for VXX to move as it's historical 'x-over vector point' is now within only a few cents away from a reference point [statistically it sits right on top of it] that printed on 5/26/21 and is a key location for a potential medium size pullback into prices that printed in May '21 [SP-500 4196, VXX 35.90] . Let's see if a turn signal prints next week.

11:36am: Intra-day breadth reversal right on cue around 11:00am time slot [typical if it holds into the close]. Watching to see if it sets up a turn signal at the close. It is more likely to be a bump with a turn signal to materialize next week.

Original post-
Chart is ES futures. The concern is critical long-term vector alignments occurring as breadth MACD is declining together with volatility instruments. Historically this always creates a top in the market at various degrees. Given the advancing nature this could be a pending first leg down or just a pivot down-up. Odds are against a small top overall but it could begin that way. A turn signal [market down] is now required to print. Most likely next week. There is an early November +/- time frame topping target on the radar. 

Note: VXX and VIX histograms are diverging positively from their prices. Breadth MACD has printed lower high #2 so one or two more lower highs likely to come until volatility instruments find their final levels [matching highs (ex.SVXY) vs lows (ex. VXX, VIX)]

Comment: McClellan Financial Publications has a very timely report.

The bots will flag here when they see a top. (1/25/202/20/20)
This Information Is For Entertainment Purposes Only. Financial Loss Can Occur From Investing.
Our favorite go to site- McVerry Report


Tuesday, October 19, 2021

Current Dow Structure / Projection

Turn signal [down] watch effective. Summation index [daily] moving towards top of range- weekly may show that a bottom has printed [or maybe it is still printing] as it is beginning to roll up [but it is still in a low range]. The November time-frame is a key target zone at the moment as it is aligning with two 'half-wave' [VectorSpike indicator] increments. Volatility instruments look like they are nearing their low targets which could indicate a move up in volatility soon.

The bots will flag here when they see a top. (1/25/202/20/20)
This Information Is For Entertainment Purposes Only. Financial Loss Can Occur From Investing.
Our favorite go to site- McVerry Report


Friday, October 15, 2021

Dow Head-And-Shoulders Potential - Updated Analysis

10/17/21 Additional study- Effective volume of advancing stocks is diminishing dramatically.

Original post:
Dow prices printing now are the most likely fit for this structure out of all the market indexes. It was also the structure for the 2015 top though quite a bit smaller and only fit at the daily degree.  The current set up also fits inside a weekly closing degree pattern so a much larger potential applies. Preliminary timing suggests an early November decline [to a neckline?]. Most likely finishing up the 'head' structure currently. Prices could move up the sloping 'potential resistance' [see label] line or print clear through that a lot higher up. If a h/s pattern is invalid, that will be apparent probably by November.

Lower chart: Breadth pattern supports a similar structure to 2015 top zone but a much larger formation and across the potential h/s rather than preliminary to it as in 2015. Does not matter as similar results can be expected to price movements. Note the inverse SVXY pattern [3 arrows up] looks to fit the possible projection. After the third arrow up concludes in the future, a dramatic re-emergence of SVXY bullish pattern should begin. A new leg up in the market. That is a much longer term expectation from here.

Commentary: ..and of course some main stream analysts are claiming the start of a new bull leg up in the market citing economic and all kinds of factors. Right on time- these debates often gain momentum around top zones. They may be a few years premature. We will see. Actually- it is always a bull market- that is the easiest 'always correct' prediction, just don't get caught in high degree corrections. The market has never taken out the low from when it first began! [yet]. You can claim to be correct always predicting a bull market but that could be risky if you are advising derivative and leveraged instrument holders and they go belly-up in corrective moves [like XIV in 2018 etc].

The bots will flag here when they see a top. (1/25/202/20/20)
This Information Is For Entertainment Purposes Only. Financial Loss Can Occur From Investing.
Our favorite go to site- McVerry Report


Thursday, October 14, 2021

Volatility Down - Indexes Printing Potential Right Shoulder

EOD: Volatility signal [lower] suggests more upside to come in the market. SP-500 is approaching the first thin blue neckline around 4440 - 4450 but that does not look like a realistic neckline. Better candidates are lower down if this is a head-and-shoulders formation.

1:00pm EST:
 Dow Industrials has the best form currently for a daily closings price head-and-shoulder structure. It should not matter which index fits more or less as in the 2015 top, the Dow Industrials had the better form at that time also. Symmetry could use a little more time- perhaps up until early November 2021 for the pattern to look better.

Original post-
The possible H/S symmetry needs more index right shoulder formation [brown line projection] and so far, that appears to be the intent as the price action seems constrained to that particular zone for now. Breadth is printing overbought numbers and [market] upside turn signals have been less than impressive.


Chart is from 10/13/21-

The bots will flag here when they see a top. (1/25/202/20/20)
This Information Is For Entertainment Purposes Only. Financial Loss Can Occur From Investing.
Our favorite go to site- McVerry Report


Wednesday, October 13, 2021

Structure Has 67% Chance Historically- Supporting Criteria Is Printing

EOD: A small turn signal down in volatility implies that the market will move up from here which then complies with the summation index which has been moving up so it may simply confirm a continuation to a retrace high somewhere above in the markets. Volatility derivatives are already at extremes so this does not indicate a directional change in volatility futures just more in the same direction until a low in volatility is printed as the summation index ascends and potentially rolls over inside the right shoulder.

1:41pm EST:
 A turn signal down in volatility [market up] is trying to print intra-day so the closing numbers will be important. Note these small turn signals in volatility are happening very rapidly but the summation index is printing a move up and has been for a while which implies it is looking for a top. When it does roll over the turn signals become valid as far as support from that indicator. That likely will occur when a retrace up is completing. Anything other than that will become apparent.

Original post-
After careful analysis, there appears to be a Head-And-Shoulders formation that has merit given the current market set up. These formations are typically unreliable at only 67% chance of completing however, it needs to be considered as demonstrated in the chart for the SP-500. There are potentially three necklines with the smallest likely near or having completed. If the retrace currently shown in brown materializes and does not take out the small neckline [thin blue line] it could be headed for lower targets. Another turn signal up in volatility [market decline] will be needed if that is to happen somewhere in the retrace. Volatility currently appears to be trying to find a bottom which would be expected at this juncture inside a possible right shoulder pattern.

Charts are daily on the left and weekly on the right hand side. Lower chart demonstrates the potential across multiple instruments in the general market. This set up could cause quite a stir but may not be a terminal top yet. Negativity in the blog sphere does not support a terminal top just yet though there was exuberance in the preceding weeks around the potential 'head' so watching closely for signals and developing patterns. SP-500 pivot drops between 9 to 12% have happened since 2000 at major topping zones prior to the actual terminal tops in a few high degree price tops so the proposed move would not be out of place as described.

The bots will flag here when they see a top. (1/25/202/20/20)
This Information Is For Entertainment Purposes Only. Financial Loss Can Occur From Investing.
Our favorite go to site- McVerry Report


Tuesday, October 12, 2021

Short Term Bias Is A Retrace Up

10:21am EST: Sentiment turns a little sour today, so up the market goes: still in whipsaw territory but leaning towards a mini-top on a retrace up to potentially create a wave down from there. SP-500 is likely closing a lower gap first.

Original post-
Overnight the triangle center was tested in ES and at pre-open ES is back at the 4355 zone which is about where cash closed yesterday. However- there was a small turn signal up in volatility at the close which puts the bias back into the short-term topping mode. There could have been a wave [i] down to the center of the triangle in ES and now a retrace back up may be underway. This also fits with a projection earlier that explored the potential for a retest of the lows before a larger turn signal down in volatility transpires [market goes up later]. A triangle break up failure looks more likely now as ES pierced into the triangle instead of bouncing immediately at the trend line even though cash may well do that.

Daily Summation Index is continuing upwards but below it's typical highs and may well be seeking the top of a small degree retrace up in the market [or something higher]. That is where the bias comes in currently. Likely the market will settle into a direction soon at least in the short-term. It was mentioned yesterday that many blogger analysts were quickly getting more optimistic but without the presentation of multiple criteria using historically proven indicators of more than a couple of formulations in support of it. A terminal high may well be at higher market prices overall yet to come but the situation is far from certain currently. In this whipsaw environment, multiple criteria supported turn signals will likely be key.

The bots will flag here when they see a top. (1/25/202/20/20)
This Information Is For Entertainment Purposes Only. Financial Loss Can Occur From Investing.
Our favorite go to site- McVerry Report

Chart from Thurs 10/7/21:

Monday, October 11, 2021

These On-Going Ratios Are Flashing Amber

EOD: A small turn signal up in volatility [market down] has printed at the close. It may indicate a retest of the triangle that tried to break up or some other recent low. Alternately it could be a beginning wind up to something larger.

2:10pm EST: SP-500 has a lower gap it may need to fill. Previous short-term projection still on tap. It has been noticed there's a majority of optimistic outlooks being proposed by analysts. Stay focused on pattern & data analysis. It will either confirm or otherwise. Looks like 50 / 50 presently among many indicators analyzed. A turn signal is often reliable and should call it when it arrives. Still waiting for one.

Original post-
In an attempt to check all additional indicators available and relationships between them in order to gauge the current market situation at all times, the following has been submitted:

There is an on-going consistency in the ratios between the drop in the *inverse ARMS index 200ma and the drop in the *inverse VIX at major tops. The ratio demonstrates a greater drop in the inverse ARMS 200ma indicator relative to the drop in the inverse VIX. By itself, it does not signal a top but with an advanced market such as the one we have now, it should be of concern. If the inverse ARMS 200ma closes the gap by accelerating high enough to eliminate the established relationship differences seen in previous 'topping' ratios, a new analysis will be presented at that time. An argument could also be made that the inverse ARMS 200ma could be inclined to move higher more in keeping with previous tops as the A / B ratio is currently quite large relatively but it may not be required to do so. A turn signal up near here will most likely support that scenario.

Regardless of the ratio details, the inverse ARMS 200ma orange descending trend line is flashing currently. The study has also been generous to avoid bias by applying the 'A' drops near the recent SP-500 lows rather than at the recent top. If the actual SP-500 high was used, the difference in ratios would be the largest seen by far. A tiny drop in inverse VIX and a huge drop in inverse ARMS 200ma. That would look extremely ominous if it turns out to be the main market index all-time highs. It would mean the indicators have currently commenced moving towards market lows from extremely significant divergences in their ratios that printed at all-time market highs. Let's see where the next turn signals appear for better directional analysis.

*The 'inverse' values were used to simplify the reading compared with market direction.

Note that a secondary study was looked at to verify general consistency in late August 2020 which it did.


The bots will flag here when they see a top. (1/25/202/20/20)
This Information Is For Entertainment Purposes Only. Financial Loss Can Occur From Investing.
Our favorite go to site- McVerry Report


Saturday, October 9, 2021

Outlook Unchanged SP-500: Checkbox 1 of 3

Previous outlook chart: Checkbox 1 is the proposed gap fill shown which is underway or a partial fill is completed. Next up- likely a retest of either the triangle break up or something lower [ES 4355 zone] . Expectation is for a turn signal up somewhere in the next few weeks. If another scenario shows itself, an update will be published.

The bots will flag here when they see a top. (1/25/202/20/20)
This Information Is For Entertainment Purposes Only. Financial Loss Can Occur From Investing.
Our favorite go to site- McVerry Report


Thursday, October 7, 2021

Likely On Tap For SP-500: Fill A Gap Or Three | Retest Lows | Run To Highs

Original post-
Several indicators are still in bottoming positions including the standard deviation which is elevated. Some more work is likely needed before a turn signal of sufficient strength takes the market to a place where it can challenge existing highs. The BB piercing on 9/20/21 is a flag going forward. The market is approaching an advanced position in it's progress.


The bots will flag here when they see a top. (1/25/202/20/20)
This Information Is For Entertainment Purposes Only. Financial Loss Can Occur From Investing.
Our favorite go to site- McVerry Report


Wednesday, October 6, 2021

Looks Like A Heavy Lifting Operation

1:03pm EST: Breadth is at oversold levels which may be approaching a capitulation situation. Once reached, the market may position itself to rebound.
 
Original post-
Small signals indicate a task to move the market up may possibly be occurring but the effort is requiring more helpers presently. As has been the case for the last few months, most moves are happening in slow motion like a ship dragging an anchor which is probably as close as far as an analogy. New highs if, and when, they arrive may not be that long-lived but it does look like one more attempt is still needed for the coup de gras.

Simply using summed parameters, the current weekly breadth is inside previous top ranges but not yet at the 2020 level. It may not be required, there are closely observed similar alignments with 2015 - (minus)319.

Weekly Breadth {param sum}:10/1/21 - (minus)208
Comparisons: 2015 - (minus)319,  2018 top#1 - (minus)89 2018 top#2 - (minus)166,  2020 top: - (minus)635

The bots will flag here when they see a top. (1/25/202/20/20)
This Information Is For Entertainment Purposes Only. Financial Loss Can Occur From Investing.
Our favorite go to site- McVerry Report


Tuesday, October 5, 2021

Expected Turn Up Underway- Potential Wave [iii] Hit

Closing confirmed a small-medium continuation [market turn up] signal. Wave [iv] pullback likely close to completing. Intra-day turn signal at wave [iii] target was medium strength. Adding those all together keeps a positive outlook for the market going forward.

The bots will flag here when they see a top. (1/25/202/20/20)
This Information Is For Entertainment Purposes Only. Financial Loss Can Occur From Investing.
Our favorite go to site- McVerry Report


More Evidence For Bottoming & Market Short-Term Turn Up

2:35pm EST: ES Chart. Note an intra-day turn signal down in volatility printed between 11:00am and closing on 10/4/21.


 12:16pm EST:
Volatility is creaking in the right direction [lower] so far. Waiting for closing numbers to show a turn signal down in volatility to confirm.

Original post-
Inverting the daily 200ma ARMS index gives us a valuable tool to compare favorable and unfavorable smoothed divergences between it and the internal VectorSpike indicator. The inverse print makes it easier to read [up = positive advancing volume]. Evidence presented indicates likely more upside to come short-term. A turn signal down in volatility is needed to confirm. The overall trend since early May in several indicators so far is not positive for the market medium-term.

Please make sure to view this in light of the prior post here.

Commentary: Probably there are more than a few looking at the current 'news' regarding debt default potential etc. as a potential catalyst for a market decline somewhere. Historical observation teaches us that these decisions are often controlled inside economic and sociological cycles and much less than by the voluntary actions of participants as many would like to perceive. Accordingly - the market already has it's course plotted in.

The bots will flag here when they see a top. (1/25/202/20/20)
This Information Is For Entertainment Purposes Only. Financial Loss Can Occur From Investing.
Our favorite go to site- McVerry Report


Monday, October 4, 2021

Waves Down Could Be Close To Completing Pivot Bottoming Phase

10/5/21: See updated review of ARMS index at bottom. Previous analysis needed a better pattern approach based on movement of it's 200ma. Notice the 27-32% retrace levels create a set-up that precedes significant tops. Also note that the nested lower degree movement entering 2020 hit -34% retrace up into the 2020 top [from the '-27%' position label on down] so this action in the index continues reaping consequences.

Note- ARMS index = (advances / declines) / (advancing volume / declining volume). So: lowering values means a climbing volume ratio [market bullish tendency].


Original post:
EOD:
 ARMS index turned up +9% after being down -68% in the prior session so there may be an attempt towards a turn signal. Also the low in ES from the prior session has held so far. Some prior gaps in volatility were also double-filled. Prices could very well crawl around for a while as breadth numbers deteriorate to levels more in keeping with a terminal top.

The bots will flag here when they see a top. (1/25/202/20/20)
This Information Is For Entertainment Purposes Only. Financial Loss Can Occur From Investing.
Our favorite go to site- McVerry Report


Sunday, October 3, 2021

Summation And Volatility Pattern Similar To 2015 Topping Process

Accepting that historical patterns can often compare favorably with similar market moves going forward, the possibility of a top similar to 2015 has increasingly appeared on the radar. Both the summation index and multiple market index moves vs. volatility derivatives can focus down to likely projections when sufficient data has printed in all supporting criteria. The advanced state of this market is flashing some interesting signals as can be seen.

The projection going forward may or may not materialize as expected though likely a final dip-buying attempt to go higher is underway as turn signals down in volatility have occurred on 9/21 [medium] and 10/1 [small] = <market up>.  A subsequent turn signal up in volatility = <market down>  anywhere near here at a daily close could be terminal so watching daily for that. Opposing signals do not normally show up frequently but the volatility in the current set up is very noisy.

Tops usually require less volatility to appear than what we currently have even if market indexes are in the process of topping ahead or behind one another. Likely there will be at least one more attempt to enter the top zone for one or more indexes similar to 2015. Time may be running out.

Upper chart: 2015 vs. 2021 comparison of weekly SVXY overlay on summation index MACD / STOCH. There is often a very close relationship between this indicator and market extremes especially using a volatility derivative. The volatility top occurred on 8/19/15 approximately 8 trading sessions from the date of the 2015 chart date [8/7/15].

Lower chart: 2015 vs. 2021 comparison of daily [SVXY / SPX / INDU ] with BOLLINGER BANDS. The MACD for SVXY is also displayed.

The bots will flag here when they see a top. (1/25/202/20/20)
This Information Is For Entertainment Purposes Only. Financial Loss Can Occur From Investing.
Our favorite go to site- McVerry Report


Friday, October 1, 2021

Bottoming Process Progressing

EOD: Marginal turn down signal in volatility so could be more market upside to come.

11:28pm EST: Daily and intra-day breadth is improving so far. A turn signal down in volatility [mkt goes higher] is trying to set up but mid-day vectors can swing either way by close so it will need to be looked at this afternoon. Vix may need to go lower preferably greater than (-) 5% to create a bidirectional vector pair that would support a volatility down turn signal potentially at a weekly degree.

Original post-
Previously it was observed that the lower prices bounding box likely needed to be a tighter ratio between instruments. There has been some improvement in that direction. However, the set up has some concerning developments. The Bollinger Bands have been pierced at the daily level and SVXY is remaining elevated although it's previous low is within the prior bounding box so it may not be required to sync. up. A noticeable amount of weakness in the market has become increasingly apparent for the last three months. Volatility flags were raised beginning in early July which resulted in the first lower BB piercing in the chart shown. A second flag has resulted in the current situation with two consecutive piercings of the BB. If this is an unwinding event, it may take some time to complete but new highs will need watching closely.

A turn signal watch in volatility is active in either direction [market up / down] and will be posted when observed. Daily summation index MACD / STOCH is still in a position typically associated with a bottoming process although it is very slowly attempting to move up. Also, as mentioned in prior posts, the 'tail down' on the 50ma on the weekly NYAD is only at a very nominal level for a top though equal in placement to the 2018 first top and actually trying to turn up slowly so could be more to go yet which puts this decline potentially into the 'pivot' category with a terminal top yet to arrive. Typically terminal tops are a few percent higher than pivot highs but can take any length of time to materialize- usually when everyone has calmed down and in a 'crisis averted' mentality only to be surprised they were walking on ever-softening quicksand.

The bots will flag here when they see a top. (1/25/202/20/20)
This Information Is For Entertainment Purposes Only. Financial Loss Can Occur From Investing.
Our favorite go to site- McVerry Report