Friday, December 31, 2021

Minor High Target Date In Focus

original post-
Not a Terminal top yet but could be a small pullback [potentially a pre-top pivot] coming up. Long-term target date frequency high at 11/4/21 [SVXY] still to be challenged. If this volatility derivative holds through the approaching minor top in the market, that may be telling for the near term outlook.

The bots will flag here when they see a top. (1/25/202/20/20)
This Information Is For Entertainment Purposes Only. Financial Loss Can Occur From Investing.

Wednesday, December 29, 2021

Targets Hit - So What's Next?

Pre-open 12/30/21 7:13am EST: Indexes, volatility and market derivative instruments all playing catch-up to each other. Often, this is the most typical behavior at tops and at prequels to tops. For example VXX has made significant new lows entering a target zone while SVXY is filling a gap down with no new all-time-highs [last high-11/4/21] just yet. None of these are practical timing events just hand-signals for now. Next timing estimate is for 1/7/22, wherever prices are at that time will not matter when a turn signal [market down] prints most likely after 1/7/22.

Commentary- 'thin holiday trading' is often used to brush-away timing events but that will not effectively change or delay any of them more than a few days either way that are already set in place.
 
Original post-
A turn signal is still required to print [market down] together with the necessary supporting criteria.

Possible options in the absence of a turn signal [market down] and with the Sept low turn signal [market up] still in effect: 1) whipsaw to a low then retrace back up  2) wave iv pullback  3) break higher to a new all time high or a lower high. Everything is on the table except frequency is indicating a possible conclusion coming up in January and a potential clean symmetry in ES futures may be printing an approach to the center of a diamond top or an A-B-C up. 


The bots will flag here when they see a top. (1/25/202/20/20)
This Information Is For Entertainment Purposes Only. Financial Loss Can Occur From Investing.

Current ES Pattern - Arms Index And Vix Movements Crossing Support Simultaneously

1:00pm EST: Likely SVXY needs to overlap the gap as it has now technically filled the opening from the 11/24/21 drop. Possibly another 1% or thereabouts. If the high from 11/4/21 is taken out in SVXY, then an updated analysis will be required.

Upper chart- market has no confirmed direction without a valid turn signal. The last one was at September '21 lows.

In the chart shown at the bottom, for visual ease, the inverse of ARMS and VIX is used to keep movement correlations consistent to the market ups and downs.

This background study using the inverse ARMS index [200ma] vs inverse VIX may be telling us something important to watch. Typically the daily inverse ARMS index 200ma has been a good indicator of market potential set ups. Only on one occasion has it continued going upwards at a major top. The majority of the time it has continued moving down [ARMS index numbers increasing] at tops similar to the current situation.

Frequencies:
At these degrees, calendar days generally are more reliable targets than number of sessions- VIX low: 4/21/20 <+282 cal days> VIX low: 1/27/21 <+282 cal days> =11/4/21 SVXY high currently holding for more than six weeks is confirming it to likely be a 'primary 1' frequency span. New lows ARE PRINTING in VXX so either that is a positive market divergence or it's a capitulation signal. Without a turn signal, it could be either one: Schrodinger's cat. However- recent daily closing numbers are trending towards capitulation which often creates a small, minor top, perhaps, as in a 'iv' pullback.

A 'primary 2' frequency span centered on 1/27/21 [=12/10/21 +/- 1] has not printed a new SVXY high. It did print a lower high inside the start of the expanding triangle [diamond?] in ES futures on 12/13/21 [12/10+1 session]. There does not appear to be another medium term frequency imminent since the 2020 decline. These two developments could be a red flag for the market going forward.

The bots will flag here when they see a top. (1/25/202/20/20)
This Information Is For Entertainment Purposes Only. Financial Loss Can Occur From Investing.

Tuesday, December 28, 2021

Internal Frequency Of Retrace Likely In Control

3:50pm EST: Right on time SVXY gap is about to close. It could complete by 12/29/21 +/- 1 which is also an approximate 3/4 wavelength target date. In addition- the symmetry in the expanding triangle is more in keeping with a diamond or an A-B-C top at the moment [3 touches upper and lower trend lines]. In this case, the 3/4 wavelength could potentially coincide with a diamond center.

Original post-
Could be approaching or at the more immediate internal 3/4 wavelength +/- on the retrace up- a potential small wave iv pullback beginning soon. The final 100% wavelength likely takes it into January '22. There is still a gap higher on SVXY that may require some partial or fully overlapping fill. The 12/23 - 12/27 date target for a minor high may now be an adjacent target to the 3/4 span date 12/29 +/-. There could be some overlap into today at these small degree frequency estimates especially given the proximity of capitulation numbers in VXX from yesterday and the 12/23-12/27 targets.

There is also the possibility of a shift in the expanding triangle labels placing 'A' at 12/10/21 high [particularly since this is also a long-term high target date] and moving 'B' to 12/20/21 low. These changes potentially put 'C' as the current pending label which may not arrive until the full wavelength high date in January '22. From past experience, a 'C' - 'D' leg in an expanding triangle can often be a fast and deep move so we shall see as that would fit expectations so far and likely a 'C' up would nix all talk of a crash while printing new highs.

Ultimately a watch for a turn signal in either direction to print at the close [market up / down] is the better signal especially since there are so many overlapping date targets now appearing.

The bots will flag here when they see a top. (1/25/202/20/20)
This Information Is For Entertainment Purposes Only. Financial Loss Can Occur From Investing.

Monday, December 27, 2021

Finally Arrived At Original Target Zone From 12/3/21

Pre-open 12/28/21 6:30am EST:  ES 4796/4802.25 is the next extension zone and target date is now at 12/23/21 +2 [sessions] which is pushing it so the session will need to be watched to see how it prints by the close. Double checking non-primary target dates has not yielded a clue just yet. In any case, this is a minor target date for a high. The higher degree frequency dates [primary] come later on into Jan '22.

Original post-
The closing numbers indicate the likelihood of a target date high zone [12/23 - 12/27] as a capitulation may be printing in volatility derivative VXX just as it hits an extension target.

The 11/4/21 high target date is still holding in SVXY [span frequency: 4/21/20 --1/27/21 -- 11/4/21 high]

The bots will flag here when they see a top. (1/25/202/20/20)
This Information Is For Entertainment Purposes Only. Financial Loss Can Occur From Investing.

Friday, December 24, 2021

Targets, Alignments & Potential Movements

Futures 12/27: Blog-sphere is mostly in a positive frame of mind. We all know how that plays out in bizarro world quite often especially if minor / primary frequencies are arriving or getting close to arrival at the platform in question. It isn't a coincidence as in the randomness aspect of the word- more like these two often do occur 'co-incidentally' fixed together near target dates. *ES 4733 and 12/23 +1 = 12/27 [session] are still targets as is VXX @ 19.39 zone.

7:52am EST: *Futures have hit 4733.50. There are always other extension targets higher- we should know by tomorrows' open. Perhaps prices will slide up the trend line to an obscure price level since a minor top is likely.

A valid turn signal should be the next good clue to directional intent. The more likely time target for one to show up may be around 1/7/22 +/- 1 [potential primary high]. The daily summation index finally got a small 'bump' on the stochastic after bottoming on 11/26/21 so this is most likely an indication that a minor top could be on it's way. The MACD is trying to turn up but is having limited success so far.
 
Original post-
12/23/21 +/-1 is a minor high target date using frequencies at two degrees-
i]
  9/28/21 -- 11/10/21 -- 12/23/21 calendar days span [shown on chart]. 
ii] 6/18/21 -- 9/20/21 -- 12/23/21 calendar days span.
Bottom chart shows a potential target completion extension for 12/23/21.

Note that 11/4/21 is still not under immediate threat and is a target date that originated back in April '20 [met in SVXY so far] - the implication is that the terminal zone may well be closing in considering this behavior of volatility derivatives. Even if it does get taken out, the timing component is still valid as we approach early '22.

As expected- lots of 'Santa Claus' rally exclamations. A nice mood lifter in keeping with the season.

The bots will flag here when they see a top. (1/25/202/20/20)
This Information Is For Entertainment Purposes Only. Financial Loss Can Occur From Investing.

Wednesday, December 22, 2021

Corrective Fibonacci Span Hit 100%

EOD: ES [Mar 18 '22] cash high from 11/22/21 at 3735 still remains to be taken out. ES [Mar 18 '22] 4743.75 is the non-cash high from 12/16/21 which also remains to be taken out cash or otherwise. A strike at 4747 zone or higher in cash would eliminate all the highs that have been holding so far. Since January '22 is still the preferred target date for a terminal higher high or a lower high, prices could expand in either direction.

HOWEVER, one or two caveats, weekly breadth is still in the gloomy depths though this week gave some relief, the red signal is as low as it has been for a long while at -219, it went as deep as the -250's at the 2020 lows so it's only 12% above that level right now. SVXY is not confirming the SP-500 highs. It topped on 11/1/21 so far. No turn signals have printed at the bottom bounces and UPRO has never overlapped any more than 38% into SVXY- both not great signs.

10:28am EST:
 ES 4717.75 zone has hit so far

Pre-open 12/23/21:
 Cleared the fib projection. Could be expected as 12/24 - 12/27 was an expected event date window +/-1 so still inside that window. Let's see if it holds into the cash opening.


Fibonacci span 'FIB.B' hit 4690 zone. If a fib corrective up, then a rejection should print next. Odds are better than average as this would represent the third fib span corrective in this structure of various sizes and SP-500 is still holding it's high from 11/22/21 target date. Once again, no closing turn signals have printed so off to another range swing most likely. Could be a swing to a new low as summation index is pegged at a low on the stochastic and the MACD is trying to lift itself off lows but not really moving higher so looks like lower yet before it bounces into mid-late Jan '22.

A long-term timing span originating on 3/16/20 [1/27/21 half span] projects to a date of 12/10/21 which is the SP-500 closing high 4712 so far so that is another event date projection helping to confirm the possible terminal nature of the current time projections.

The bots will flag here when they see a top. (1/25/202/20/20)
This Information Is For Entertainment Purposes Only. Financial Loss Can Occur From Investing.

Two Single Span Fibonacci Correctives Possible

EOD: Looks like the day ended hitting the potential 'FIB. B' 100% mark at the 4690 zone.

Our old friends - the single span fib corrective are shown [FIB.A / FIB.B]. Typically, once hit, they have retraced fully and beyond the origin which is the recent low. A bottom needs to print so the attack at the highs around 1/22 - 1/29/22 can happen [presuming those event dates continue to fit with current price moves]. Note that as long as the UPRO overlap down from the high relative to the SVXY decline remains below 50% [currently 38% overlap] the upside in this leg is likely constrained. Also, no turn signals have printed since 11/22/21 turn down. Momentum-sized signals have printed but those are insufficient for a longer-term directional change. More patience required into late January- which is not that far away.


The bots will flag here when they see a top. (1/25/202/20/20)
This Information Is For Entertainment Purposes Only. Financial Loss Can Occur From Investing.

Tuesday, December 21, 2021

Updated Frequency Map- Terminal Top Potential

EOD: Extreme breadth swings- fully negative yesterday - fully positive today. Watching for an event possibly into 12/23- 12/27 [either side of the holiday closed days]. A bottom may still need to print in this range. Goose is just about done. A bounce from a bottom may be all there is left.

Looking at the longer term frequency map back to March 2020 lows- it is saying 'out of time' at that degree. Other frequency origins prior to March 2020 can project further into '22 than Jan '22 but this is the best shot given the market set up currently while looking at all the supporting parameters, breadth, summation, arms index etc. If a development looks to be setting up beyond the current time targets, it will be analyzed accordingly. A daily closing turn signal in either direction should be the next directional signal. UPRO still has not overlapped lower by equal or more than 50% of SVXY which would be typical if a new leg very much higher was underway. SP-500 high on 11/22/21 was a projected time event and is still holding.


The bots will flag here when they see a top. (1/25/202/20/20)
This Information Is For Entertainment Purposes Only. Financial Loss Can Occur From Investing.

Monday, December 20, 2021

Time Is Most Likely Extending

The next outside wave time points need to be considered as viable targets 1/22/22 - 1/29/22. Note that the inside wave on this frequency map has called out the SP-500 high so far to date and the next interpolation date is shown as an outside wave target. At any point before then, a turn signal in either direction may set prices moving out of range.

From 12/15/21 post- [looks like the thought here is applying, and then some]

"10:50am EST: Treading water- closing values will hopefully give a better clue. Negativity from recent down market action may need to burn off using time so could stretch out to a couple of weeks even if that seems like quite the delay, the next wave length [span-time] data point could push it out that far."

Commentary: -The very next best thing is for the market to continuously cry "Wolf" on a weekly time basis without actually going into a major decline- the consensus then becomes 'consolidation' or 'bull flag' - whichever. If a turn signal [market up] prints- off and running higher, otherwise could be trouble. With breadth still in the gloomy depths and UPRO still not breaking low enough [less than 50% compared to SVXY]. Could be looking to a bigger decline- even a terminal top if this keeps up. Looks like today so far- no concerns in the blog-sphere generally speaking so the effect mentioned seems to be working it's magic - keep rocking the boat but short of capsizing while the smart survivors gather their precious items and don their life-jackets in preparation.
 

The bots will flag here when they see a top. (1/25/202/20/20)
This Information Is For Entertainment Purposes Only. Financial Loss Can Occur From Investing.

Saturday, December 18, 2021

Why It Is Difficult To Acknowledge The Existence Of This Particular Natural Cycle

The idea that something else could exert 'control' over events is abhorrent to us as people with independent thought and intellect. That seems to be alien and foreign to our ability and belief that we determine how things unfold and develop. [Up to a point] - asteroids have clobbered the moon and the earth and observable objects in their rotating orbits. We can even calculate the next appearance of the very significant ones. So far, that is beyond our control and we seem to accept that for now as being the reality. But still there are efforts to thwart even these events regarding any object that's headed directly at the planet. So- here is where we do engage our independent thought by deciding HOW TO REACT once we accept the reality [and reliability] of the calculated prediction [aka. risk analysis].

However, that is a celestial phenomena, we say- not OUR stock market. The evidence is that cycles in everything are part of universal behavior. Even in acknowledging that, we are still resistant to 'letting go' [aka 'arguing' with the market] and it continuously mocks the analysts and pundits on a regular basis. Estimates are that 95% of market participants do not succeed in gauging direction correctly on a regular basis.

The application of mathematics and geometry is where the real mystery and difficulty lies. The 'Pi' constant factor appears in many time measurements at very large degrees. Not surprisingly pi is intimately connected to rotating [circular] object geometry which also is connected to the swinging of a pendulum. In this case the geometry is TIME. Even if the idea still offends us- why ignore it when it can help us to decide how to react?

In the chart below note that the event at '3' could be as close as it's going to get to creating a turn signal up in volatility [market declines] unless one prints between now and post-Christmas. If the estimates are way off, the evidence will become clearer if prices move dramatically out of range upwards. A terminal top is not anticipated at this time but a correction of some size is a real possibility.

The bots will flag here when they see a top. (1/25/202/20/20)
This Information Is For Entertainment Purposes Only. Financial Loss Can Occur From Investing.

Friday, December 17, 2021

Next Stop To Where Exactly?

EOD: No turn signal yet. Most likely next week Christmas Eve/ post-Christmas. Looks like the internal frequency on this retrace is in charge though today was a strong candidate for a continuation of a 1/a down from the high on 12/16/21.

10:35am EST: Could be looking at a wave 1/a down in ES Mar 18 '22. A retrace into next week might be the set up for a turn signal then [unless one prints today at the close]. There are gaps created so that might support a retrace.

original post-
12/17/21 was referenced in the 
previous post as an event target date / zone. Looks like the new lows certainly qualifies as an 'event'. A range-bound up/down could print until next week to burn off the fear OR a turn signal prints sooner. All options regarding a pattern are definitely open. Event target dates seem to be in close proximity to movements so far to date.

Watching for a turn signal to print at the close any day now. A second and perhaps more urgent frequency time target analysis done inside the current move upwards is targeting 12/24 or thereabouts [post- Christmas?]
---------------------
..and here is an example of the rhetoric that is often referred to on this blog-[see below]

 The logic demonstrated here takes the form of what seems to be very 'reasoned' thinking. As difficult as it seems to be to understand and even conceive- the market has it''s own internal mechanism which is why there occasionally seems to be a disconnect and at other times the connection to reality seems to be irrefutable. Note especially a reference to 'conventional wisdom' - red flag, the market is already pre-set to move at specific times- no human 'wisdom' required

Note the last statement "
Argue with this market at your peril." It could be re-stated "Argue with this market's internal mechanics at your peril. Read on.. there is a certain complacency that comes from 'being right' and we all know complacency will bite you sooner or later- bullish or bearish. The intro part is often proven to be correct but resulting conclusions may be skewed.

"If there is one thing we know about stock market crashes, they are breathtakingly quick. Stop
to ask questions and you get left holding the bag. But here we stand, three weeks from the initial Omicron outbreak and the index is still within 1% of all-time highs. If these headlines were going to break us, it would have happened by now. To further compound bears’ confusion, Wednesday the Fed told us to expect three interest rate hikes next year. Conventional wisdom warns us that rate hikes are bad for stocks, yet prices surged 1.6% on the news. As I’ve been saying for a while, a market that refuses to go down will eventually go up. Bears have thrown everything they can at this bull and it keeps shrugging it off. If this was going to crash, it would have happened by now. Argue with this market at your peril."
---------------------
ok- now, for example note the 2020 decline happened close to COVID 'showing up'. However, this blog was warning of a pending market decline situation weeks before that event. There was no privileged access to information regarding a virus developing a rapid attack close to that decline. How is the rise that followed the March low explained away? It never will be done successfully without looking at frequencies at varying degrees all the way forward from the very beginning of the markets and particularly, the 2002, 2009 lows and others.

For a very brief description on the evidence for frequencies, see this post [at the bottom of that post]. Also check Martin Armstrong's work on cycles. The method used here sometimes touches these other approaches, an alternative approach is used on this blog but the same principles apply. Evidence-based analysis is never 'incorrect' unless data points are mis-aligned somehow during the calculations. [it happens]. That is why turn signals are vital in the application for new market directions. They are also required to be calculated correctly.

This Information Is For Entertainment Purposes Only. Financial Loss Can Occur From Investing.

Thursday, December 16, 2021

Frequency Target On Friday Together With Likely 5th Wave Hit

Update 12/17/21: There is a target date internal to the retrace up for the following Friday next week 12/24. So that zone post-Christmas[?] may print an event/turn signal if there isn't one today/Monday.

Original post-
Possible 5th wave hit at fib extension target as posted here. Now, a frequency target calculates to 12/17/21. Still no turn signal and VXX [volatility] may have a marginally lower number alignment yet to hit so Friday/Monday could get SP-500 cash close to all of these. Weekly breadth is pretty much in the toilet at the moment if you'll pardon the expression.

The main contrarian set-up to this scenario not working at a larger degree is the blog-sphere sounding alarms. It has been enumerated here that a terminal top is less likely now but a corrective move of some size is pending. Perhaps the time frame will extend while prices remain range-bound inside targets until everyone is joyful again. There is also another possibility that has been considered: an expanding triangle [megaphone] may be in play with the recent accelerating leg up being a 'C-D' leg which readers of this blog will recognize in the label protocol for megaphones to be fast and a precursor to an 'E' leg in the opposite direction [market decline]. If this materializes, the 'E' target hit lower will likely start a new leg up. This will blind-side more than a few. The early '22 terminal top may then become the next higher target. Let's take it one signal and frequency at a time for now.

The bots will flag here when they see a top. (1/25/202/20/20)
This Information Is For Entertainment Purposes Only. Financial Loss Can Occur From Investing.

Potential Fifth Wave Targets Lining Up

10:15am EST: SP-500 cash from 11/22 still holding. For how long? Should have been under threat if the frequency time target was not correct. VXX could hit it's final target at the same time that SP-500 cash hits a new high, higher or not. At this stage, the turn signal is the only event of worth so still waiting on that to show up at a close.

Fib ext. [Mar 18 '22] ES 4743 zone hit pre-open [attenuated 5th wave?]

A medium term frequency recalculation is pointing to today/tomorrow for a potential event- new ATH, lower/higher cash etc...and of course, any 'news' logic [up means down, down means up] attached to a market move fails miserably because the market has it's own internal mechanics pretty much fixed in place as per usual and often mentioned here.


The bots will flag here when they see a top. (1/25/202/20/20)
This Information Is For Entertainment Purposes Only. Financial Loss Can Occur From Investing.

Wednesday, December 15, 2021

Potential Cash Triangle Breakout

EOD: Vix gap lower is closing as noted below = positive leaning. Lots of whipsaw action so it needs to steady down. Lower targets in volatility derivative VXX likely. Indexes do not necessarily need to go that much higher for VXX to hit it's next target lower. Just waiting on a turn signal at any close to give us the 'heads-up' on ultimate direction. UPRO never has resolved it's track lower in accordance with a 'normal' leg up move so this is now a game of chicken but better not play games right now. Wave length time targets since 11/22/21 are still holding. A change in momentum [market up] printed at the close [not surprisingly] but it wasn't a valid turn signal as would normally appear in a longer-term leg up. Options remain open. Once everyone is back to feeling jolly after the recent 'scares' it might pull the rug.

10:50am EST: Treading water- closing values will hopefully give a better clue. Negativity from recent down market action may need to burn off using time so could stretch out to a couple of weeks even if that seems like quite the delay, the next wave length [span-time] data point could push it out that far. Intra-day signals show support for more upside but it is still early in the session.

Original post-
A micro timing window on the retrace up has an option for today+/- to print a turn signal down. The next data point is in two weeks so anywhere inside these two is also valid. A break-down here does 'look' appropriate but looks do not count. Signals do. If prices climb back inside the triangle, the timing option extends. Some negativity in blog-sphere may be a contrarian positive. Also- the summation index [daily] does not show more than a small bump of this retrace up on the stochastic. The weekly is positioned correctly for a decline so options are still open, all things considered. A signal will be the decider most likely. VIX does have a gap lower down = positive leaning.

Note the 'inclusive' fibonacci horizontal white lines marking 0-100 alignments of the recent decline. Typically, this could retrace back up close to the 0% origin in a corrective continuation or it could go beyond and create a new leg higher. Pre-open could be building a bull flag right at the cash triangle lower trend line with a target somewhere inside the triangle or higher.. 'Interesting' was the description around last week's posts specifically for 12/13-14 this week and it is certainly living up to it. 

Commentary: cannot resist it - 'Santa' may be on his way for all you romantics out there. Why not- some good ol' fashion seasonal pleasantries are always welcome.

The bots will flag here when they see a top. (1/25/202/20/20)
This Information Is For Entertainment Purposes Only. Financial Loss Can Occur From Investing.


Tuesday, December 14, 2021

Signal Line-Up: Turn-Size Down Still Pending

1:46pm EST. ES 4589.75 looks like a better 0-100 fib inclusive leg target for now.

10:37am EST:
 A bounce is likely at 4623 zone [a fib ext]. Could be setting up to challenge the current immediate highs and drive down VXX to a lower target...or not. Also ES 4615 or 4603 zones are potential 100% downside target for our old friend, the a 0-100 inclusive fib structure that has printed a number of times recently and has been a multi-directional overlapping corrective posture mostly.

Original post:
Expectations from several criteria at various degrees together with 2 x half-span time targets strongly suggests a turn-signal down in the market is pending. Not necessarily expecting a terminal top to print just yet but the set up could morph quickly into something larger. Behavior is generally similar to a large-ish degree top building at the moment. If not a terminal top just yet, early '22 has time target options.

Going back to the previous post that referenced the disconnected behavior of UPRO - it was the strongest short-term indicator that upside was the less likely option. That set-up has not resolved yet..could take some time so watchful patience is required with a daily closing turn-signal down in the market being the decider at the moment. Watching price movements is not productive in real time for anything other than very short-term. Evening reviews are where the signals show up.

Just looking at the current price pattern, today's close could potentially print a turn signal. A change in momentum-sized signal down did print on 12/9 and that is often a 'heads-up' within a day or so of an actual valid turn down signal. Usually a review is done after all the numbers are in and confirmed during the evening.

There are some indicators still displaying a less-than-optimum position on the daily such as the summation index but it's weekly position is satisfactory for a decline to begin so that may create a delay while the daily print position looks more favorable. It isn't required since the weekly is set up but it is a possibility and might explain a delay.

The bots will flag here when they see a top. (1/25/202/20/20)
This Information Is For Entertainment Purposes Only. Financial Loss Can Occur From Investing.
Our favorite go to site- McVerry Report


Monday, December 13, 2021

ES Close Enough To 4733.50 For The Pop

Pop and drop was a possibility today as noted on the chart from 12/10/21. So far that has happened but no closing turn signal yet so some more to go. Could be fairly soon. The fib origin at 4664 zone retraced almost the whole amount down after the 100% fib hit at 4731 [4733.5 target]. Breadth was negative but not extreme so could be open to a turn signal any day now. VXX did bounce at it's first target zone. There is a lower target zone but if a turn signal prints prior to that being hit, all bets are off.

SP-500 high [2 x half span target on 11/22/21] still holding.

The bots will flag here when they see a top. (1/25/202/20/20)
This Information Is For Entertainment Purposes Only. Financial Loss Can Occur From Investing.
Our favorite go to site- McVerry Report


Friday, December 10, 2021

Script Remains On Target

Upper chart seems to be staying within key expectations / projected movements so far. Next week will be very interesting. 12/13 - 14 may create an event.

Lower chart shows the frequency theory of half-span interpreted using a different mathematical key. The same basic theory of frequency applies. Half-span calculations enumerate a frequency derived using a different micro approach.  All Star Charts has produced a great video: here.

The bots will flag here when they see a top. (1/25/202/20/20)
This Information Is For Entertainment Purposes Only. Financial Loss Can Occur From Investing.
Our favorite go to site- McVerry Report


Cash Still Needs To Catch Up- And Main Stream Is Leaning Ecstatic

12:52pm EST: Continues to follow the script. ES 4733.50 is a fib target zone. [pennies below 11/22 cash high]. So far today. breadth is not printing large upside numbers. A negative weekly print may or may not print at the close setting up for a market decline next week around the 2 x half-span target date 12/13/21 +/-.

Original post-
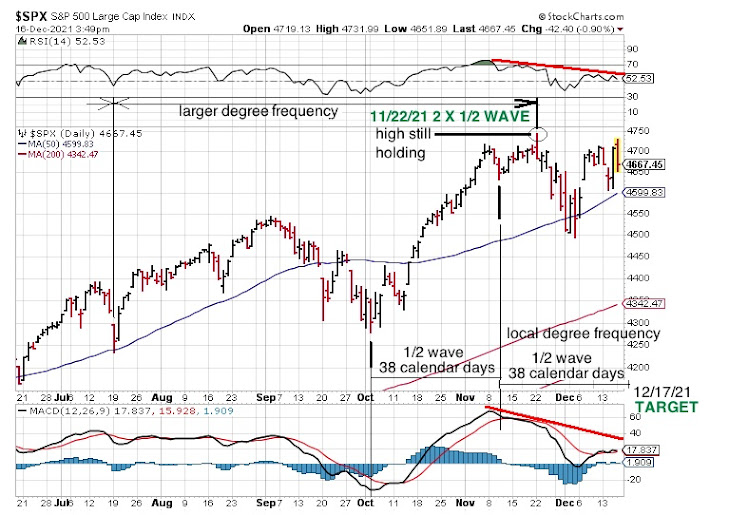
Chart from 12/9/21 is essentially unchanged. The cash target beckons. Once hit, let's see what further developments print after that. If the half-span targets have been correctly analyzed, the market is now trussed-up like the proverbial goose. SP-500 high is still holding and UPRO never has tracked lower to it's minimum confirmation on this leg. A 'momentum turn' sized parameter printed on 12/9/21 at the close which may have been due to the very short term move down or it could be a fore-bear. These frequently occur adjacent to tops within a day or so.

Commentary- a popular main stream pundit said of the market "a wonder to behold" and everything looks rosy for '22. Some might see that as a red flag in a contrarian world. No matter if the market kisses a few more roses on the way up, the half-span x 2 time line is immovable wherever it lands. Checking and re-checking at several degrees (2007+, 2019+, Sept 2021+ ) keeps bringing the half-span targets into the current time window and early '22 for a potential terminal top. If the data points on these separate time-lines have been incorrectly plotted, it is not yet apparent. Most recently 11/22/21 half-span SP-500 cash time target initiated a short-term decline that may be of unknown 'overall' term since it is still holding as a high [so far].

New all-time highs could up the odds of a terminal top arriving more quickly as that might imply the recent decline as being the 'pivot'.

The bots will flag here when they see a top. (1/25/202/20/20)
This Information Is For Entertainment Purposes Only. Financial Loss Can Occur From Investing.
Our favorite go to site- McVerry Report