Still waiting for the Z targets to hit in either chart. Could be fireworks after that happens.
Another down tick on the weekly breadth. Breadth in the last 12 weeks was 50% up but the last 6 weeks it is only 33% up so trending down while market climbs overall. Not entirely long-term bullish.
If the down impulse is dominant it could simply mean that a pre-top decline might print prior to the actual top. This happens about 70% of the time.
1918 Pandemic Did Not Tank The Market!
See Critical Long-Term Review Here
Friday, May 29, 2020

The Only Target That Really Matters
Update: 11:06pm EST. Possibly another down tick on the weekly breadth if the current direction persists into the close. Breadth in the last 12 weeks was 50% up but the last 6 weeks will see only 33% up weeks so trending down while market climbs overall. Not entirely long-term bullish.
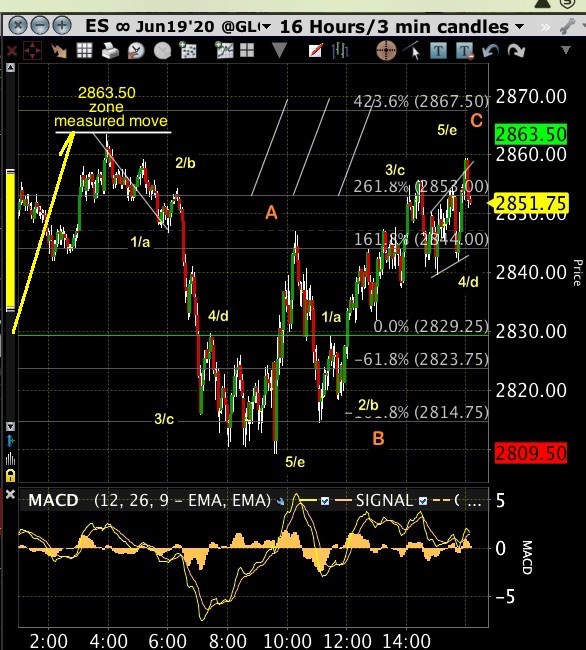
Wherever ES / Market needs to get to in order for VXX to hit it's lows is the only real target that will have any significance going forward. Could be in for a long wait. 16 x 4hr candles so far and still counting...
1918 Pandemic Did Not Tank The Market!
See Critical Long-Term Review Here
Wherever ES / Market needs to get to in order for VXX to hit it's lows is the only real target that will have any significance going forward. Could be in for a long wait. 16 x 4hr candles so far and still counting...
1918 Pandemic Did Not Tank The Market!
See Critical Long-Term Review Here

Thursday, May 28, 2020
Higher Targets Are Needed
See latest post
EOD: Market is making hard work of getting to a new low on volatility. It is possible that it will accelerate downwards when everyone is convinced the market is heading into orbit which will set the trap. The market may also require a larger pullback to create a slingshot move up to a new high that takes the volatility out and sets the trap from there.
It took 11 x 4hr candles between X and Y prints and so far we have 5 x 4hr candles from Y so could take another 2 or 3 days to print Z based on the same elapsed time span. It is not required to take that exact amount of time so we will have to see.
original post:
Still do not have the final low on VXX volatility derivative so may need a drive higher to push it there.
1918 Pandemic Did Not Tank The Market!
See Critical Long-Term Review Here

Tuesday, May 26, 2020
Upside Targets In Focus
See latest post
Update 2:00pm EST. As anticipated- looks like VXX low is to be challenged or taken out.
 1918 Pandemic Did Not Tank The Market!
See Critical Long-Term Review Here
Update 2:00pm EST. As anticipated- looks like VXX low is to be challenged or taken out.
See Critical Long-Term Review Here

Friday, May 22, 2020
Micro Divergence- Not So Micro, Could Be Huge.
Looking now at VXX volatility derivative- it seems to be aligning with the signal line on $nyad MACD that is peaking at it's third attempt (lower peak) which also has a large multi-week negative divergence (see bottom chart). Some kind of move reaction does look imminent considering these both together. Expectation is that VXX moves up after a hit on 'Z' target and market heads down perhaps not exactly at the same time. Often there is a lead or lag between the two.
1918 Pandemic Did Not Tank The Market!
See Critical Long-Term Review Here
1918 Pandemic Did Not Tank The Market!
See Critical Long-Term Review Here

Downside Projection - Non Committed Market
Vectors remain indecisive as to the current status but we are watching the blue rolling signal on the lower chart which may be about to form a lower peak for the third time since mid-April. Price projections are nominal based on a minimum initial down move. Larger moves may or may not come into play which would naturally shift targets lower.
Latest 'news cycle': "Rudderless After A Rally.." - ok or 'non-committed' as this posts title describes it but what does that actually mean?. In all likelihood there is a filling of inventory happening in the price range that is printing and externally it looks like nothing is really committed one way or the other. That is an error in analysis or description at least. Trades are still moving prices just not in a dramatic way- yet. Divergences are building positive or negative. Currently longer term moves are creating a negative aspect in divergences (see bottom chart). We read the current signals only and they tell us when to go or not.
1918 Pandemic Did Not Tank The Market!
See Critical Long-Term Review Here
Forget the 'news cycle'- we report on what is actually happening in the majority trading environment
Latest 'news cycle': "Rudderless After A Rally.." - ok or 'non-committed' as this posts title describes it but what does that actually mean?. In all likelihood there is a filling of inventory happening in the price range that is printing and externally it looks like nothing is really committed one way or the other. That is an error in analysis or description at least. Trades are still moving prices just not in a dramatic way- yet. Divergences are building positive or negative. Currently longer term moves are creating a negative aspect in divergences (see bottom chart). We read the current signals only and they tell us when to go or not.
1918 Pandemic Did Not Tank The Market!
See Critical Long-Term Review Here
See Important Long-Term VIX Study
..and possible bounces/bottoms: (2/28/20) , (3/23/20)
This Information Is For Entertainment Purposes Only. Financial Loss Can Occur From Investing.

Daily S&P (upper plot) vs advance-decline ($nyad) MACD signal line (blue):
not much change to speak of at close 4/21/20- blue signal now @14.578 (#3 peaking?)

not much change to speak of at close 4/21/20- blue signal now @14.578 (#3 peaking?)
Thursday, May 21, 2020
Rollin'- Rock-A-Bye Targets
update: 2:35pm EST. intra-day put/call ratio somewhere around 0.76 which is trending complacent. Also breadth could be accelerating or peaking.
Or rockin' an rollin' - whatever it looks like it's trying desperately to take the breadth signal level down far enough to make a difference and bringing in fresh buying blood every time it does this so could be in for a long wait until that critical level gets hit. Volatility derivative VXX is within 6% of it's previous low on 5/12 so definitely a candidate to be challenged at this point in the absence of any significant market down moves. Vectors are not conclusive at the moment other than the previous top flags at 4/30 and 5/11 that created short-term drops but should not be discounted as being meaningful since the 5/11 top created the current VXX low on 5/12 which has yet to be taken out. As we said though- that could well be challenged.
1918 Pandemic Did Not Tank The Market!
See Critical Long-Term Review Here
..and possible bounces/bottoms: (2/28/20) , (3/23/20)
This Information Is For Entertainment Purposes Only. Financial Loss Can Occur From Investing.
Daily S&P (upper plot) vs advance-decline ($nyad) MACD signal line (blue):
Wednesday, May 20, 2020
More Top Targets
See latest post
After Hours Update: Pullback from 2975.75 was expected. Most likely a breadth decline is required prior to higher prices so we shall see how that plays out. The volatility derivative VXX is holding up above it's lows which it may well challenge or take out as ES hits higher peaks, It is not required though as there are enough signals in place at the present time to facilitate an acceleration down move at any point going forward.
Large Y and Z measured extensions are being targeted unless it is done here. Looks like the 'rolling top' scenario was well-described as we continue to print tops and bottoms within a continuing loose price range.
1918 Pandemic Did Not Tank The Market!
See Critical Long-Term Review Here
..and possible bounces/bottoms: (2/28/20) , (3/23/20)
This Information Is For Entertainment Purposes Only. Financial Loss Can Occur From Investing.

Monday, May 18, 2020
1918 Pandemic Did Not Tank The Market!
(See 1918 Commentary and Pandemic Chart at bottom of page)
Current Chart Projection:
EOD: Lack of vaccine positivity did not tank the market- it was always coming. We called it as a possibility yesterday with the 'X' terminating signal lining up together with market breadth decline. Still remains to be see whether a 'Z' print occurs.
 |
| Add caption |
Update: 2:36pm EST.
A series of market pullbacks within the X-Y-Z terminating structure often produces a declining breadth situation over several days while the market creates new peaks. This in turn can create the negative divergence between breadth and market action required to finalize a top at the micro level if that is what this current situation is printing.

1918 Pandemic Made New All-Time High!
At VectorSpike we have consistently maintained that events do not by themselves move markets. In order to try and offer an opposing idea to the recent covid-19 arrival as the reason given for the market decline and pending 'recession', we want you to take a look at the market action during the 1918 pandemic. We maintain that the charts will print whatever is happening in the current geometry no matter what else seems to be occurring in the 'news' cycle. We think this is a dramatic example of why we see the current decline as the ending of a corrective grand supercycle wave 3 and not a virus-shock event. The timing of a viral outbreak is mostly quite independent of market geometry as is obvious from the following chart. The megaphone that began printing in 1915/1916 was printing it's geometry just like the one now that began in 2018 and the virus arrived anywhere within the time window. The timing is purely coincidental on any hit within the upper or lower trend line on either megaphone printed then and now. It isn't that difficult to see the idea we are proposing- events alone do not drive market geometry. Period.
See Critical Long-Term Review Here
..and possible bounces/bottoms: (2/28/20) , (3/23/20)
This Information Is For Entertainment Purposes Only. Financial Loss Can Occur From Investing.

Expanding Diagonal Lower High
EOD: It is possible that large 'X' needs to print a large 'Y' and 'Z" higher or that small 'x' 'y' and 'z' are all we are going to get. ES 2964.75 was a quarter point from hitting flag 1 high of 2965.0 so technically flag high 1 still stands so far.

Update: 2:451pm EST
ES 2965 could be taken out but it looks so far like the volatility low may prevail and keep the longer term top option open. Put/call is hitting 0.70 intraday so trending lower into complacency which also fits a topping scenario.
Commentary: If this next 'top' scenario has any lasting down side potential value, it should be a top predicated on optimism and It looks very much like the news is trending positive along with buyers attitude. As we continue to state, news is not the driver of market action even though it appears to be overwhelmingly so at times. The arrival of covid-19 appears to correlate with the previous large drop scenario except it was being noted at VectorSpike that all was not well in the charts prior to that event with a detailed description of what appeared to be transpiring at the time and had been for a while. We maintain that it is only the charts that will provide the true trading picture and we do not regard whatever reasons are being attached to those moves that 'seem' relevant.
For example - we do have a rough comparison with a previous virus pandemic and market action at it's onset. We are assembling that chart right now as part of an update so please check back- and here it is: note the market (DJIA) went up a good 50 percent initially, It was part of a larger megaphone leg just as we have been describing the current situation here at VectorSpike except the 1918 virus arrival event roughly coincided with a lower megaphone trend line hit close to Jan 1918 and moved up approximately 50% from there for a good 20 months before that leg topped in Oct 1919.
We agree that this is a sample of two virus events overall so statistically not a large sample. However, we think that the rarity and impact of these events levels the statistical playing field somewhat. The point that we are trying to make is that trading goes on between partners uniquely involved in the trade and what they do is only reflected in what can be seen in the charts- the reasons for those moves cannot otherwise be easily disseminated. A disciplined data movements approach will out-perform any other criteria that we have seen to date. The below is a good example of what we may 'think' is happening. Shouldn't the market have tanked in Jan 1918 like today if news theory still applied equally as well then as now? Instead, it goes on to a new all-time high after some minor hesitation!
 Update: 11:45pm EST. Starting to see the first potential 'terminating countdown' vector movement at 'X'. Normally this would be the first of three with 'Y' coming next and the final move 'Z'. Expectation is that these conclude while VXX may remain above it's current low of 31.42 and ES does not take out 2965. There remains the possibility that ES high or VXX low could be taken out but not both (usually) and the rolling top scenario stays valid.
 Update: 11:13pm EST. Expectation is that ES price high at top top flag 2 (lower top than flag 1) could be taken out. However, as long as the VXX low holds, which it is at the moment, the 'rolling top' scenario remains valid for now.
With all of the 'crash' talk it was anticipated that a 'rolling top' would best fit the scenario to create sufficient dip buying prior to an acceleration top. In very typical fashion- a deep retrace is more often part of the 'regular' topping structure we see all the time. The previous top that was a one shot down move more or less was an exception that occurs much less often.
Also- we did note one vector that would look better with a filled gap (probably more dip buying req'd to fill this).
See Critical Long-Term Review Here
Update: 2:451pm EST
ES 2965 could be taken out but it looks so far like the volatility low may prevail and keep the longer term top option open. Put/call is hitting 0.70 intraday so trending lower into complacency which also fits a topping scenario.
Commentary: If this next 'top' scenario has any lasting down side potential value, it should be a top predicated on optimism and It looks very much like the news is trending positive along with buyers attitude. As we continue to state, news is not the driver of market action even though it appears to be overwhelmingly so at times. The arrival of covid-19 appears to correlate with the previous large drop scenario except it was being noted at VectorSpike that all was not well in the charts prior to that event with a detailed description of what appeared to be transpiring at the time and had been for a while. We maintain that it is only the charts that will provide the true trading picture and we do not regard whatever reasons are being attached to those moves that 'seem' relevant.
For example - we do have a rough comparison with a previous virus pandemic and market action at it's onset. We are assembling that chart right now as part of an update so please check back- and here it is: note the market (DJIA) went up a good 50 percent initially, It was part of a larger megaphone leg just as we have been describing the current situation here at VectorSpike except the 1918 virus arrival event roughly coincided with a lower megaphone trend line hit close to Jan 1918 and moved up approximately 50% from there for a good 20 months before that leg topped in Oct 1919.
We agree that this is a sample of two virus events overall so statistically not a large sample. However, we think that the rarity and impact of these events levels the statistical playing field somewhat. The point that we are trying to make is that trading goes on between partners uniquely involved in the trade and what they do is only reflected in what can be seen in the charts- the reasons for those moves cannot otherwise be easily disseminated. A disciplined data movements approach will out-perform any other criteria that we have seen to date. The below is a good example of what we may 'think' is happening. Shouldn't the market have tanked in Jan 1918 like today if news theory still applied equally as well then as now? Instead, it goes on to a new all-time high after some minor hesitation!
With all of the 'crash' talk it was anticipated that a 'rolling top' would best fit the scenario to create sufficient dip buying prior to an acceleration top. In very typical fashion- a deep retrace is more often part of the 'regular' topping structure we see all the time. The previous top that was a one shot down move more or less was an exception that occurs much less often.
Also- we did note one vector that would look better with a filled gap (probably more dip buying req'd to fill this).
See Critical Long-Term Review Here
..and possible bounces/bottoms: (2/28/20) , (3/23/20)
This Information Is For Entertainment Purposes Only. Financial Loss Can Occur From Investing.

Friday, May 15, 2020
Lower High Completion Target Zone
See latest post.
EOD: Looks like a 13-week (weekly) low may be pending on the put/call ratio. That might indicate complacency equal to the peak zone on 2/10/20. Price action- See 15min and 3min charts potential count:
See Critical Long-Term Review Here
EOD: Looks like a 13-week (weekly) low may be pending on the put/call ratio. That might indicate complacency equal to the peak zone on 2/10/20. Price action- See 15min and 3min charts potential count:
See Critical Long-Term Review Here
..and possible bounces/bottoms: (2/28/20) , (3/23/20)
This Information Is For Entertainment Purposes Only. Financial Loss Can Occur From Investing.

Thursday, May 14, 2020
Down Leg Price Progression- Nested Target
EOD: Upper targets (retrace):

Update: 3:15pm EST. Most likely a continuation of the 'rolling top' scenario. Anything more will become apparent soon.
Nothing is indicating any change in the overall downward progression yet. There is a nested leg target hit at ES 2760.25 that is printing a retrace today.
See Critical Long-Term Review Here
..and possible bounces/bottoms: (2/28/20) , (3/23/20)
This Information Is For Entertainment Purposes Only. Financial Loss Can Occur From Investing.

Tuesday, May 12, 2020
Downward Acceleration Initial Projections
See latest post
Looks like the next leg down could be initiating. Likely to be a 'rolling start' prior to the main down thrust while the breadth MACD signal reaches deeper into negative territory. This would also be expected as an alternation to the first thrust which was unceasing and rapid.
See Critical Long-Term Review Here
..and possible bounces/bottoms: (2/28/20) , (3/23/20)
This Information Is For Entertainment Purposes Only. Financial Loss Can Occur From Investing.

Subscribe to:
Posts (Atom)