Saturday, October 31, 2020

Topping Process Uses Vectors and Breadth Factors

Readers of this blog will have seen these types of studies used before at critical junctures with some success:

Breadth MACD is now beginning to diverge upwards as SP-500 prices head lower on the mini-leg down. This should resolve in a reversal upwards. This is just one of several studies we are currently using to anticipate the next market move. Chart on the left is used as a comparison set up prior to the large degree top earlier this year. The 'JAN 2019' descriptor should read 'JAN 2020'.

The controlling structure may be a medium degree wave 4 up about to complete after this leg bounces back up to a new high on ES and on *SVXY- See related post

See Critical Long-Term Review Here
The bots will flag here when they see a top. (1/25/202/20/209/4/20)
This Information Is For Entertainment Purposes Only. Financial Loss Can Occur From Investing.
Our favorite go to site- McVerry Report

Friday, October 30, 2020

Closing In On This Bottom- Next Up: New High Then Slam Dunk?

EOD:  Still needs to hit lower ES targets/ higher VXX targets.

Still most likely not at the market's ultimate low on this leg. However, it is going to be like pouring the very last of molasses from a cold pitcher. Maybe one/two more weeks?

The controlling structure may be a medium degree wave 4 up about to complete after this leg bounces back up to a new high on ES and on *SVXY- See related post

*VXX should take out it's current low after it's higher targets are nixed and some positive divergence shows on the daily breadth MACD chart.

See Critical Long-Term
 Review Here
The bots will flag here when they see a top. (1/25/202/20/209/4/20)
This Information Is For Entertainment Purposes Only. Financial Loss Can Occur From Investing.
Our favorite go to site- McVerry Report


Thursday, October 29, 2020

Re-Label Waves: New Target Zone Lower

Please do not forget:

The controlling structure may be a medium degree wave 4 up about to complete after this leg bounces back up to a new high on ES and on *SVXY- See related post

*VXX should take out it's current low

See Critical Long-Term
 Review Here
The bots will flag here when they see a top. (1/25/202/20/209/4/20)
This Information Is For Entertainment Purposes Only. Financial Loss Can Occur From Investing.
Our favorite go to site- McVerry Report


Wednesday, October 28, 2020

Down Side Target Zone Looks To Extend

Update 11:05am: ES 3260 zone looks like a good candidate for a first nested wave 'iii' area on both  ES down and VXX up (27.74). More market decline is likely expected. Nested iii-iv, iii-iv, -v will likely overlap and look compressed until completion. Completion could be close to the previous ES low zone of 3196 on 9/24/20. Then a strong move up to finish the wave 4 up on SVXY is anticipated.

Update 10:07am: ES 3292 zone is an alternate measured target that may react.

ES is most likely not done as VXX vectors look to extend even higher. Could be a pullback pending (red 'B' up?) before that happens. Longer term prognosis is that a contracting triangle 'look' could finish printing with an upside breakout that could 'wrong foot' anyone not paying attention.

Gentle Reminder:
Please do not forget:
The controlling structure may be a medium degree wave 4 up about to complete on SVXY- See related post

See Critical Long-Term
 Review Here
The bots will flag here when they see a top. (1/25/202/20/209/4/20)
This Information Is For Entertainment Purposes Only. Financial Loss Can Occur From Investing.
Our favorite go to site- McVerry Report

Monday, October 26, 2020

On The Move- More Downside Forthcoming

EOD: VXX wave iv pullback looks done. Next nested wave iii up probably underway. Market remains in decline mode.

Update 1:52pm: VXX most likely working on it's first nested wave iv pullback. Expectation is for more VXX upside to come (market continues modest decline).

Update 11:46pm: Looks like VXX is nesting i-ii, i-ii up and working on first nested iii target. This will most likely take time to complete. Meanwhile, it would be expedient to see weekly breadth numbers deteriorate in expectation for the real market top to appear later on. (This would be a wave 4 up completion on SVXY that would then produce a wave 5 down to new lows on SVXY but only a partial pull back on the general market). This disconnect between SVXY and the general market does happen often and at larger degrees the disconnect also gets large.

New VXX higher targets are in focus. After those targets hit, most likely a reversal to market new highs to complete a larger degree wave 4 on SVXY. It is expected that VXX would take out it's lows at that time. Still looks like the market is in no hurry so be prepared to wait it out.

Please do not forget:
The controlling structure may be a medium degree wave 4 up about to complete on SVXY- See related post

See Critical Long-Term Review Here
The bots will flag here when they see a top. (1/25/202/20/209/4/20)
This Information Is For Entertainment Purposes Only. Financial Loss Can Occur From Investing.
Our favorite go to site- McVerry Report

Trend Line Squeeze- Downside Targets

Update 11:23am: 3377.75 is an ES downside target zone which may coincide with VXX 23.78 first upside zone. Looks like it's tightening in around that target zone.

Update 11:10am: VXX could be heading for targets shown. Market needs to descend fully. Could take the rest of the week with a negative breadth printed by then hopefully. That would get the set up ready for new highs on negative weekly breadth that could possibly print a more reliable top.

Opening gaps today (if any) will most likely spend the rest of today back-filling to eat up even more time. Eventually, prices may run out of room for places to go (up or down). We are still waiting for VXX upside targets to complete (down side in the market). VXX chart is shown on the right overlay- white down arrows are a measured move that may have completed.

9:10 am: ES targets 3412 (already hit) or 3402 zone would equal a i-ii-iii down on a downward fib extension from small white 'e'.

See Critical Long-Term
 Review Here
The bots will flag here when they see a top. (1/25/202/20/209/4/20)
This Information Is For Entertainment Purposes Only. Financial Loss Can Occur From Investing.
Our favorite go to site- McVerry Report

Saturday, October 24, 2020

Overview Of Molasses Market

No, not the stuff you eat, as good as that is, but feels like we're wading through bunker oil at the moment. 

UPDATE: VIX expanding triangle = Imminent Short-term bump in VXX. Then the real top of the market should begin to develop (dark downward arrow on bottom right VXX chart)


Previous post commented:

"Looking for a negative breadth on the weekly to give us an overall 'progression' clue prior to any new all-time high prices. A negative weekly breadth number at a new all-time high is usually an amber flag. Multiple back-to-back weekly negative breadth numbers tends towards a red flag. That may not happen for another week or two at this rate so staying focused."

-That did not happen yet.

We may have driven close enough to the upper trend line (line drawn through orange 'b') to get a reaction at some point. VXX still 'owes' us a visit to upper targets shown (market needs to descend most likely). The closing action did get us close to a measured move up on the latest 'mini'-leg up from the futures low on 10/22 and VXX may have pulled back a similar measured amount- both actions would support a short-term (ES futures 100 point?) decline pending:

See Critical Long-Term Review Here
The bots will flag here when they see a top. (1/25/202/20/209/4/20)
This Information Is For Entertainment Purposes Only. Financial Loss Can Occur From Investing.
Our favorite go to site- McVerry Report


Friday, October 23, 2020

Week-Ending Decision Time Or More Of The Same?

Looking for a negative breadth on the weekly to give us an overall 'progression' clue prior to any new all-time high prices. A negative weekly breadth number at a new all-time high is usually an amber flag. Multiple back-to-back weekly negative breadth numbers tends towards a red flag. That may not happen for another week or two at this rate so staying focused.

See Critical Long-Term Review Here
The bots will flag here when they see a top. (1/25/202/20/209/4/20)
This Information Is For Entertainment Purposes Only. Financial Loss Can Occur From Investing.
Our favorite go to site- McVerry Report

Wednesday, October 21, 2020

And The Beat Goes On- But Better Pay Attention

The "pay attention" bit: (expect *medium degree fireworks around VXX new low, 20.50 price zone):

* larger degree would refer to the drop from 2/20/20 (large wave down on SVXY)

The controlling structure may be a medium degree wave 4 up about to complete on SVXY- See related post

Current short-term higher VXX target zone is shown using hatch lines.

See Critical Long-Term
 Review Here
The bots will flag here when they see a top. (1/25/202/20/209/4/20)
This Information Is For Entertainment Purposes Only. Financial Loss Can Occur From Investing.
Our favorite go to site- McVerry Report

Monday, October 19, 2020

Market Barely Moving But Has A Plan

The controlling structure may be a larger degree wave 4 up about to complete on SVXY- See related post

See Critical Long-Term
 Review Here
The bots will flag here when they see a top. (1/25/202/20/209/4/20)
This Information Is For Entertainment Purposes Only. Financial Loss Can Occur From Investing.
Our favorite go to site- McVerry Report


Saturday, October 17, 2020

This Volatility Derivative Could Have Printed A Huge 'Tell'


Chart 1: SVXY has failed to keep up with the market by an extremely large amount! Why? Please see the proposed potential answer: (wave 'v' down could be about to unfold at the enclosing degree shown)

Chart 2: Current ES set up: (after 'D' leg down, should move up to 'E')

See Critical Long-Term Review Here
The bots will flag here when they see a top. (1/25/202/20/209/4/20)
This Information Is For Entertainment Purposes Only. Financial Loss Can Occur From Investing.
Our favorite go to site- McVerry Report


Friday, October 16, 2020

Wave 4 Down Keeps The Market In Idle Mode

Could be looking at two more weeks before any significant new signals. Breadth is barely degrading at all and needs to move lower on the weekly chart prior to the market making anything significant as far as a top on this leg up.

See Critical Long-Term Review Here
The bots will flag here when they see a top. (1/25/202/20/209/4/20)
This Information Is For Entertainment Purposes Only. Financial Loss Can Occur From Investing.
Our favorite go to site- McVerry Report

Thursday, October 15, 2020

Expected Short-Term Pullback Looking To Complete

EOD: Looks like a 3 waves down to the fib target followed by 3 waves back up to the 3481 zone or higher- 3481 is a legitimate calculated fib target so a bounce back down could be expected to complete a wave 'iv' pullback (green square label)

See Critical Long-Term Review Here
The bots will flag here when they see a top. (1/25/202/20/209/4/20)
This Information Is For Entertainment Purposes Only. Financial Loss Can Occur From Investing.
Our favorite go to site- McVerry Report

Tuesday, October 13, 2020

Likely Short-Term Pullback Zone

Update 2:24m EST: Could be a small wave 'v' or 'e' down to finish the short-term pullback. Still missing a hit on ES 3549.50.

Update 11:58am EST: Small a-b-c (i-ii-iii) down has completed. Possible scenario- now/soon headed for ES 3549.50 (a 'critical' value target). VXX and ES would then have hit equivalent respective 'critical' value targets which could produce a reaction pullback. If one or both continues through their respective targets then that negates this scenario. In  either case, the market may still have a long way to go to the upside eventually.

A review of the other market index (Dow Jones) looks to be lacking in price movement so far. Several other vectors we follow have not hit optimum so looks like more to go after a pullback in ES futures.

See Critical Long-Term Review Here
The bots will flag here when they see a top. (1/25/202/20/209/4/20)
This Information Is For Entertainment Purposes Only. Financial Loss Can Occur From Investing.
Our favorite go to site- McVerry Report

Monday, October 12, 2020

'Pi' Daily Time Interval Hit On First Extension Target

ES has hit at a fib extension (3534/3543 zone) target together with a similar VXX hit. Looks like a preliminary pause or pullback area as ES has more to go. The trend line is most likely coincidental as it is the critical extension targets themselves that provide the better signals. The current hit on ES looks like a non-critical target value so far but may lend itself to a pullback that develops prior to the final move up. If ES hits 3549.50 - that would be a more critical target.

See Critical Long-Term Review Here
The bots will flag here when they see a top. (1/25/202/20/209/4/20)
This Information Is For Entertainment Purposes Only. Financial Loss Can Occur From Investing.
Our favorite go to site- McVerry Report

Saturday, October 10, 2020

Very Telling Signals Have Appeared

Weekly NYAD MACD is close to printing a negative week and positive divergence on VXX (hourly) has materialized exactly at it's 1.6 fib extension of prices from wave 'iv' down on 10/2. Currently wave 'v' up has printed the same length as wave 'iii' up on ES if wave labels are close so there could be a reaction along with all the other markers noted. There is room for more upside in the market and a new assessment of wave labels could be forthcoming so let's see how it all transpires.

See Critical Long-Term Review Here
The bots will flag here when they see a top. (1/25/202/20/209/4/20)
This Information Is For Entertainment Purposes Only. Financial Loss Can Occur From Investing.
Our favorite go to site- McVerry Report


Friday, October 9, 2020

Going Straight For Upper Trend Line Of Triangle

Small 'A' up and 'B' down likely completed where shown. VXX finally broke down into it's real downward phase giving us a more reliable signal which should conclude at a market top zone.

Time symmetry could take us into late next week to hit the target zone.

See Critical Long-Term Review Here
The bots will flag here when they see a top. (1/25/202/20/209/4/20)
This Information Is For Entertainment Purposes Only. Financial Loss Can Occur From Investing.
Our favorite go to site- McVerry Report


Thursday, October 8, 2020

Wave 'A' Up Final Target Zone

Update: 10:55am EST: 3433.25 is a legitimate extension target zone for wave 'iii' up.

See Critical Long-Term Review Here
The bots will flag here when they see a top. (1/25/202/20/209/4/20)
This Information Is For Entertainment Purposes Only. Financial Loss Can Occur From Investing.
Our favorite go to site- McVerry Report


Wednesday, October 7, 2020

Deep Retrace Completed Or 'A' Up Still Needs To Print

See Critical Long-Term Review Here
The bots will flag here when they see a top. (1/25/202/20/209/4/20)
This Information Is For Entertainment Purposes Only. Financial Loss Can Occur From Investing.
Our favorite go to site- McVerry Report

Updated chart 10/8/20 7:25am EST:


Tuesday, October 6, 2020

Wave 'V' of 'A' Up Looks Complete

Update 10/7/20 10:00am: Retrace up targets at 3395.75, 3396.5, 3399, 3404.75, 3409. 

After hours: A fast i-ii-iii down has printed which could be setting up for the wave 'B' down complement to the 'A' up shown in the chart. Overnight it has already retraced approximately 48% up off it's low. Typical would be a large bounce soon after it bottoms ('C' wave up to create the leg completion) not necessarily to a new all-time high but could challenge the highs. VIX daily has accelerated up 5.4% and often leads VXX which only moved 1.4% so there is some upward divergence forming on VXX suggesting more short-term daily downside candles forming in the market probably with lots of overlap in prices.

Interesting that VXX seems to have a (concrete?) bottom formed since 8/26/20. That is quite unusual without a chronic accelerated decline in the market. It has not hit it's tipping point in time or it either: needs to make another low hit or take out it's current bottom. One or both could happen most likely when a weekly low put-call prints. Could be getting close when we see new, larger highs ('C' wave up). The end game seems to be in process- now just a matter of waiting and tracking criteria parameters.

See Critical Long-Term Review Here
The bots will flag here when they see a top. (1/25/202/20/209/4/20)
This Information Is For Entertainment Purposes Only. Financial Loss Can Occur From Investing.
Our favorite go to site- McVerry Report


Monday, October 5, 2020

Wave 'A' Up Still In Process

Update: 10/6/20 10:50am EST: 3406 TARGET ZONE HIT. Will there be a reaction into the close from here?

Looking to see if there's a reaction at 3406 price zone. Several vectors are converging on that target.

See Critical Long-Term Review Here
The bots will flag here when they see a top. (1/25/202/20/209/4/20)
This Information Is For Entertainment Purposes Only. Financial Loss Can Occur From Investing.
Our favorite go to site- McVerry Report

Saturday, October 3, 2020

Next: Overlapping Wave Down Then Back Up To Complete The Leg


Commentary: 10/5/20 08:00am EST:  We are still in the price zone range for either a pending wave 'iv' down + 'v' up or a continuation to make a 'B' wave down. Also pay no attention to the men behind the curtain in the news cycle- it is merely a distraction by the main stream media/less-critically-informed analysts. We are most likely not at the top of the current leg beginning 9/24. Smart horse traders are only interested in the animals on offer in the trading arena including any of their own- they are the strongest force bar none during that time. They come away with the best outcome on their trade(s) and they determine the overall success level of the auction. They are not normally swayed by a sudden change in the weather. Period. In the long run-

News Event = Market Move= Nonsense!

Possible overlapping wave down from 3357 to 'B' target zone. Fairly rapid reaction from there to finish the leg up. Alternate scenario- we are done with a (white lettering) 'iv' at 3306 zone and 'v' up is underway.

See Critical Long-Term
 Review Here
The bots will flag here when they see a top. (1/25/202/20/209/4/20)
This Information Is For Entertainment Purposes Only. Financial Loss Can Occur From Investing.
Our favorite go to site- McVerry Report


Friday, October 2, 2020

It's Not The News- It's The Pattern Progression

EOD: Print is still on target for a "B' wave down to complete in the next few sessions. Weekly breadth signal line came up but held a little below the '0' datum. We anticipate additional downside as the vectors filled opening gaps although SP-500 may need more upside.

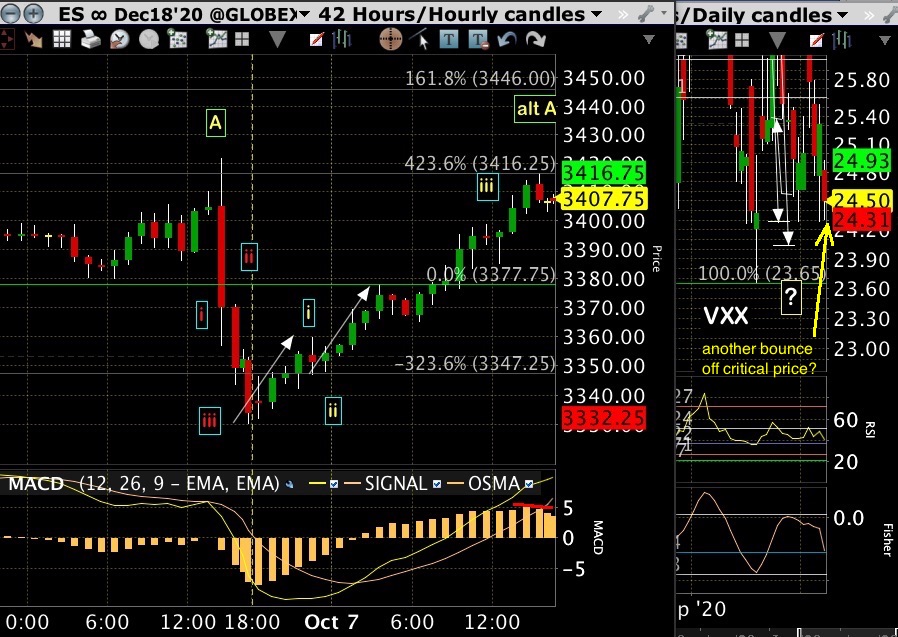
update: 12:20pm EST:  Vectors are most likely filling gaps created at the open. At the commencement of a more serious move, gaps are often left behind so full or partial filling like this could fit with our multi-day 'B' wave - down scenario with today's daily candle potentially being the longest overall in the candle group that will eventually terminate the wave near the target zone. Assuming this is indeed the 'B' wave and not a shorter and faster (white lettering) wave 'iv' down, of course.

Ok- headlines has a news event driving the market overnight once again. We will continue to reinforce the idea that this is never what is happening- never. How did we know a news event would take the market overnight to the price zone area we postulated yesterday? We did not. We still maintain the time window given in the last post to next week for completion for the small 'B' wave down if that is what it turns out to be. We could still be off but let's see how closely it tracks. One of the most difficult concepts to understand is the disconnection between the market and news that definitely exists no matter what it looks like. For example-we projected a large decline potential immediately prior to covid arriving in the USA. We asked the same question then- since the news was fussing that the market was hit by the virus, and if true, how did we know the future of the virus hitting? (nonsense, right?). Statistically large moves happen more often with no apparent news event in the proximity. At this point, this is not even a large move relatively speaking.

Back to price movements- notice the contracting right triangle forming as a right shoulder to a head-and-shoulder pattern miles ahead of the news event that happened later. Also there is a 'Pi' daily time divisor that just 'happened' to coincide timing-wise. A similar move happened on the previous day at that time but no one made a big fuss over it. Let's not get over-excited just yet. There is still ample time for patterns to print their intentions.

From yesterday's post: "B' target potentially 3280 price zone." -Once 'B' completes, a  'C' move up could finish this short/medium-term top. After a subsequent decline completes from this next terminal top, very likely off to new all-time-highs.

See Critical Long-Term Review Here
The bots will flag here when they see a top. (1/25/202/20/209/4/20)
This Information Is For Entertainment Purposes Only. Financial Loss Can Occur From Investing.
Our favorite go to site- McVerry Report