Friday, January 29, 2021

Lower Nominal Target Zone Hit

See latest post 2/1/21

EOD: Whenever this leg down completes, new all-time-highs are on tap.

Another huge 'Tell' is setting up:


A somewhat extended wave 'iii' (alt a-b-c down) has hit. Since it is extended, we need see how it closes.

See Critical Long-Term Review Here
The bots will flag here when they see a top. (1/25/202/20/204/9/20)
This Information Is For Entertainment Purposes Only. Financial Loss Can Occur From Investing.
Our favorite go to site- McVerry Report


Thursday, January 28, 2021

Likely Pre-Top Move(s) On Cue

EOD: More 'whack-a-mole'...

Update: 12:32 pm EST: Until the market hits the upper targets, there is absolutely nothing reliable to hang your hat on. Brave souls can profit of course but whipsaw fatigue can leave you in no-man's land for a while.

VIX is now testing 76% pullback while VXX is hitting new highs above Nov 13 2020 high. An unstable situation at any time. VVIX (VIX volatility) remains elevated.

ES is approaching  3825.25 target zone.

Update 10:29 EST: Up/down overlapping everywhere you look- sure sign of a corrective structure continuing.
VIX is testing a 62% pullback zone. 
ES futures has printed 'i-ii-iii' waves up to 3806.25. (alt 3816 zone), (next 3825.25)
Breadth trying to climb out again.
Patience needed - sit back, relax and wait for terminal move to arrive. Take up a hobby.

Charts:
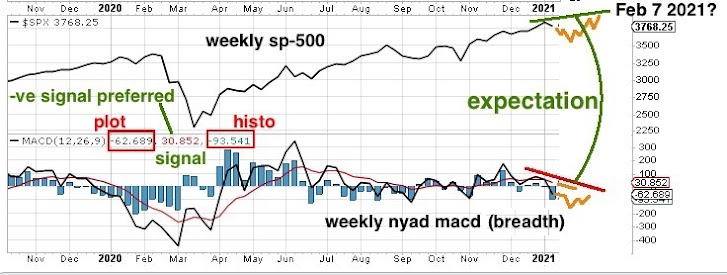
            i) NYAD
Weekly longer term study

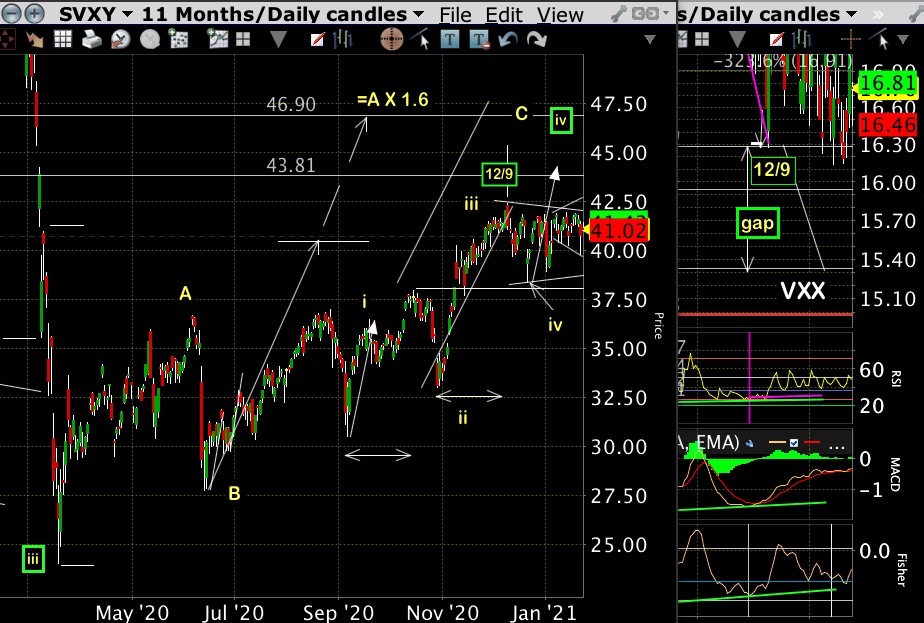
            ii) SVXY
A pre-top move is often part of a wave 4 pullback at some degree. Note that SVXY is expected to print exactly that.
SVXY HAS MORPHED INTO A CORRECTIVE EXPANDING DIAGONAL 'D' PULLBACK PRIOR TO A TERMINATING 'E' WAVE UP.

          iii) ES futures WATCHING 3680 ZONE LOWER
 Most likely looking for a bottom inside the megaphone.      

          iv) NYAD close-up
We need to see the weekly closing print to confirm but the size and speed looks like there will be sufficient momentum to endure to the weekly closing. Let's see if it confirms into Friday's close. Alternatively, it could extend into next week before there is a confirming pattern. NYAD standard deviation could be a little lower but the trend line print has been in an uptrend for a while so could still be valid.

REF NOTE- SEE WHERE THE 'BIG ONE' WAS FLAGGED HERE IN FEB 2020.
(Similar set up now but is not expected to create a new low- eventually a new all-time-high)
Chart below updates the one seen in the link just above (NYAD WEEKLY STUDY)

See Critical Long-Term
 Review Here
The bots will flag here when they see a top. (1/25/202/20/204/9/20)
This Information Is For Entertainment Purposes Only. Financial Loss Can Occur From Investing.
Our favorite go to site- McVerry Report


Wednesday, January 27, 2021

Consolidation Prior To Final Push

EOD: Center of megaphone test failed to resist so now we're headed for the lower trend line in the larger megaphone.

Update 10:30 am EST: See new updated hourly chart. Regular readers will be familiar with the use of megaphones in pattern analysis. Many times, the fastest largest intermediate leg is the 'C-D' one (depending on your preferred labelling criteria). The current leg appears to fit that description based on it's speed/size and position in the potential megaphone asymmetry.

Aa anticipated in 1/22/21 post, a center zone test of the developing expanding right triangle (aka: megaphone) is most likely prior to the final push up.

This potentially fulfills the requirements for NYAD weekly breadth decline (& NYAD lower std deviation) and the increasing strength of VXX on the daily.

See Critical Long-Term Review Here
The bots will flag here when they see a top. (1/25/202/20/204/9/20)
This Information Is For Entertainment Purposes Only. Financial Loss Can Occur From Investing.
Our favorite go to site- McVerry Report


Tuesday, January 26, 2021

Higher Confidence Print- Inverse Volatility Derivative SVXY

See bottom chart: (SVXY)

After checking all the market patterns, the best looking seems to be in the area of volatility. In particular SVXY which currently may be printing a large 'C' leg up and doing that impulsively in it's latter half from early September.

Could be a contracting right triangle finishing up presently 'iii-iv' so there's room for more downside inside that triangle which may fulfill the weekly breadth decline requirement that is needed prior to a medium degree top printing.

ES futures may be finishing a small 5 min chart leg up. (upper chart)

See Critical Long-Term Review Here
The bots will flag here when they see a top. (1/25/202/20/204/9/20)
This Information Is For Entertainment Purposes Only. Financial Loss Can Occur From Investing.
Our favorite go to site- McVerry Report


Monday, January 25, 2021

Running The Clock Out- Targets In Focus

EOD:  Small wave iii up at 3851 zone.

Updated chart 2:04pm EST:  Bottom chart is 3 min retrace up plot.

Updated chart 1:00pm EST: 
 Volatility continues inside small megaphone. No change to upper targets. VXX looks like a seriously 'coiled' structure since Dec 9 2020.

Anticipating a February time window for this medium term leg to finally top.

Currently we need higher WEEKLY: a) market prices, b) lower VXX prices, and c) negative breadth signals before the next medium term top prints, (after that- a pullback and then a new all-time high later on)

See Critical Long-Term Review Here
The bots will flag here when they see a top. (1/25/202/20/204/9/20)
This Information Is For Entertainment Purposes Only. Financial Loss Can Occur From Investing.
Our favorite go to site- McVerry Report


Saturday, January 23, 2021

Very Long Term Update & Short Term Projection

As can be seen, VectorSpike long-term projection is holding as drawn on April 2 2020. No redrawing of the proposed price print has been applied other than labels. The pattern still looks on target. There was an expected lower print possibility after 3/23/20 but that did not materialize. Other than that, the expectation is remarkably accurate at this degree so far.

The comparison with Glenn Neely (square inset) who is the undisputed analyst success according to 'Timing' magazine is shown. Glenn is not perfect but as close as any analyst we have seen when it counts. We differ somewhat going forward as can be seen. The system employed for our projections uses many more parameters than Glenn's geometry-only EW (neowave) analysis which can often be subject to more alternates that creates more variables and opportunity for misses. Let's see how the expectations transpire. The high degree wave '4' is valid at both higher and lower locations. When the time gets closer, that will become clearer.

Currently we need higher WEEKLY: a) market prices, b) lower VXX prices, and c) negative breadth signals before the next medium term top prints approximately at the 1/22/21 pointer zone shown in the top chart. (next- a pullback and then a new high at yellow '3'.

Bottom chart is an earlier print of the hourly pattern. Prices climbed back to 3845 zone (2nd chart).

See Critical Long-Term Review Here
The bots will flag here when they see a top. (1/25/202/20/204/9/20)
This Information Is For Entertainment Purposes Only. Financial Loss Can Occur From Investing.
Our favorite go to site- McVerry Report


Friday, January 22, 2021

Top Requires Weekly Breadth Decline(s)

EOD: Enthusiastic dip buyers may have saved the day. However, we got a second consecutive weekly negative print on the NYAD MACD CHART just not a negative signal (red) yet but it only printed +15 so there is room for the structure next week to make a third weekly negative print. Meanwhile, SP-500 new weekly highs are printing so it is definitely negatively diverging and has been since 11/30/20. Downside pressure continues to build but is not yet at optimum expected higher price or lower breadth levels. 

Is A-B-C up done? There was reaction at 3845 zone so we will have to see how that develops next week.


UPDATE: 12:52pm EST: VIX has closed it's opening gap.

Apparently. yesterday's VIX penetration lower occurred right at wave 'iii' shown. It was a signal for a minor pullback. It was also posted here as being part of the signal group required for a pending top event. We could be entering that final countdown. As posted, expectation is for this next medium term top to be a partial correction prior to the next ATH. Many will panic and call it the 'crash'. It may not be pretty but the vectors and long-term pattern looks much bigger and require objective focus and patience. Hopefully, the analysis here will help with that.


If there is a weekly breadth decline at close today, that will print TWO CONSECUTIVE NYAD MACD WEEKLY NEGATIVE PRINTS which could set it up nicely for a top during the next several sessions following. Today could also print the first negative weekly (red) signal print as it currently sits at zero so we shall see.

There could be an opening gap up in VIX that will require closing either today or in another session so that remains to be seen

See Critical Long-Term Review Here
The bots will flag here when they see a top. (1/25/202/20/204/9/20)
This Information Is For Entertainment Purposes Only. Financial Loss Can Occur From Investing.
Our favorite go to site- McVerry Repor

Thursday, January 21, 2021

Critical 'Pending-Top' Signal Arrives

One of the things that particularly shows up as prices begin to zero in on a target number is a low penetration in the VIX. In the current environment there has been long-term chronic support line since 11/30 comprising a 6-point equi-spaced lower limit. That line is finally seeing penetration. 

At the same time we are seeing a flattened 'S' in the weekly NYAD breadth MACD SIGNAL line (red) develop. See bottom chart. Note how much less amplitude there is than the previous. This is a pointer to the expectation posted here that the pending top will be that of a less dramatic correction though still fairly significant as far as a potential trade. Post this next correction, new highs will be expected. This is a high degree structure currently developing not usually seen in a 'normal' lifetime.

See Critical Long-Term Review Here
The bots will flag here when they see a top. (1/25/202/20/204/9/20)
This Information Is For Entertainment Purposes Only. Financial Loss Can Occur From Investing.
Our favorite go to site- McVerry Report


Wednesday, January 20, 2021

Overlapping Structural Targets

See Critical Long-Term Review Here
The bots will flag here when they see a top. (1/25/202/20/204/9/20)
This Information Is For Entertainment Purposes Only. Financial Loss Can Occur From Investing.
Our favorite go to site- McVerry Report


Potential Corrective Inside Megaphone

Update 10:34 am EST: Structure is still building- Potential confluence at 3841.75 / 3855.25

Structure reset better fits a down/sideways megaphone inside the larger one. VIX is approaching next larger support trend line a small percent below yesterday (total of 6 connected straight line low points from 11/30/20).

VXX may be targeting 15.94 price zone short term.

VIX volatility [VVIX] has been in an uptrend for a similar amount of time and has initiated an acceleration leg up since 12/9/20.

See Critical Long-Term Review Here
The bots will flag here when they see a top. (1/25/202/20/204/9/20)
This Information Is For Entertainment Purposes Only. Financial Loss Can Occur From Investing.
Our favorite go to site- McVerry Report


Tuesday, January 19, 2021

Corrective Back Inside Megaphone Targets

Update 3:25pm EST: VIX is hitting lower trend line support.

Update 1:14pm EST: 
 Volatility derivative SVXY arriving at resistance zone. See bottom chart.

VIX has been in a weekly and daily uptrend since 11/30/20.

See Critical Long-Term Review Here
The bots will flag here when they see a top. (1/25/202/20/204/9/20)
This Information Is For Entertainment Purposes Only. Financial Loss Can Occur From Investing.
Our favorite go to site- McVerry Report


Saturday, January 16, 2021

Looking For Continuation Down To Target Zone

See latest post 1/19/21

See potential retrace targets from 1/18/21 movement on 15 min chart at bottom.

Several vectors are pointing to lower market targets for next week. Expectation for VXX to climb higher before getting slapped back down to fill it's lower targets.. Weekly breadth chart at bottom will look better with a negative 'signal' print prior to a concluding intra-month temporary top on this leg from March 23 2020.

See Critical Long-Term Review Here
The bots will flag here when they see a top. (1/25/202/20/204/9/20)
This Information Is For Entertainment Purposes Only. Financial Loss Can Occur From Investing.
Our favorite go to site- McVerry Report


Friday, January 15, 2021

3 Waves Down So Far Intra-day

EOD: Orange label leg down could be targeting below the current low (iii- optimal).

Update 3:20 pm EST: could measure 3 waves back up to  ES 3777.75.

See Critical Long-Term Review Here
The bots will flag here when they see a top. (1/25/202/20/204/9/20)
This Information Is For Entertainment Purposes Only. Financial Loss Can Occur From Investing.
Our favorite go to site- McVerry Report


Vix Rising Support On Lower Trend Line Hit

Looks like the green leg has stalled or completed. Yellow leg is still in play, A rising lower trend line on VIX was hit at point 'A' as weakness was already showing so we will have to see how that plays out inside the yellow label leg. VVIX (vix volatility) is 19% above it's lower trend line at pre-open. Still looking at Feb 7 2021 window for a turning point- most likely a top.

REMEMBER: Daily moves have very little to do with any stimulus news event, up or down, other than a cycle confluence if it exists- Weakness was pointed out 3 trading sessions prior.

See Critical Long-Term Review Here
The bots will flag here when they see a top. (1/25/202/20/204/9/20)
This Information Is For Entertainment Purposes Only. Financial Loss Can Occur From Investing.
Our favorite go to site- McVerry Report


Wednesday, January 13, 2021

ES Futures Stalled Inside Targets

Update 10:58am EST: Could be doing some very short-term 'gap-up' filling in volatility VIX and VVIX. (market heads up temporarily). Still looking at 2/7/21 for a Pi date high or low price zone. Odds favor a high so the market has to kill some time before then.

ES Futures may be showing weakness.

See Critical Long-Term Review Here
The bots will flag here when they see a top. (1/25/202/20/204/9/20)
This Information Is For Entertainment Purposes Only. Financial Loss Can Occur From Investing.
Our favorite go to site- McVerry Report


Monday, January 11, 2021

ES 3858-3881 Targets In Focus

Also see previous post

See Critical Long-Term Review Here
The bots will flag here when they see a top. (1/25/202/20/204/9/20)
This Information Is For Entertainment Purposes Only. Financial Loss Can Occur From Investing.
Our favorite go to site- McVerry Report


Saturday, January 9, 2021

Heading Into Next Upper Targets

Megaphone is still the preferred structure so it could print a 'top' anywhere near the targets (potential large white 'C' at the 'iii-c' label upper chart). We still do not see any larger degree decline whenever it occurs taking out the March 23 2020 low. A smaller degree top may be more likely as other parameters and vectors are not shouting 'topped'. It might attempt a pullback inside the daily megaphone a small amount before striking higher even taking out the projected targets shown.

As per usual VXX will give the most reliable signal when it declines into it's target area along with prices at new highs.

See Critical Long-Term Review Here
The bots will flag here when they see a top. (1/25/202/20/204/9/20)
This Information Is For Entertainment Purposes Only. Financial Loss Can Occur From Investing.
Our favorite go to site- McVerry Report