EOD: SP-500 and [UPRO] continuation signals printed at the close so still looks good for a retrace target to hit 2/3/22 +/-1.
A 'momentum turn signal' [34 / 37-53optimal] printed on 1/28/22 at the close- less than a full on turn signal so expectation is for the retrace to possibly complete by 2/3/22 +/-1. ES 4643 is the upper 76% target zone. After that- more down to a higher or lower low. Odds favor lower or double-bottom.
Current status: ES may retest the potential upper trend line of the contracting triangle where it is attempting to break out.
Current status: ES may retest the potential upper trend line of the contracting triangle where it is attempting to break out.
Make sure to see post: Tops-you can't make this up.
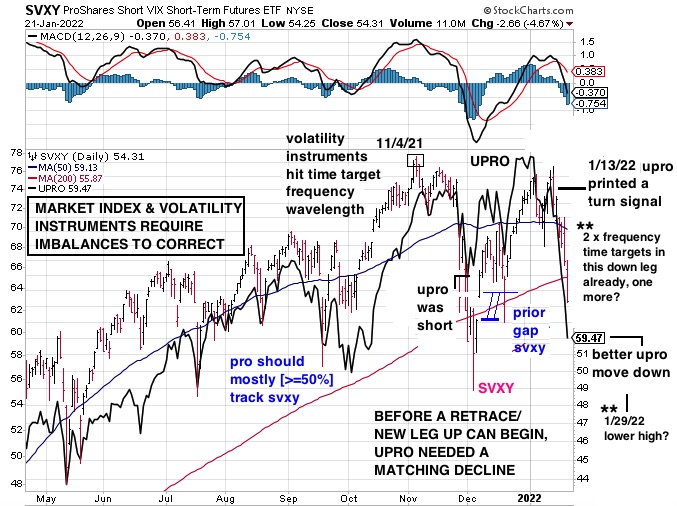
Note that target date highs could be filled by- index highs, inverse volatility highs or derivative instrument opposite pair highs/lows- separately or all together. Whichever way it divides [rotates] the higher degree trend is the driving engine.
Current examples- SVXY high 11/4/21 holding, ES high 1/5/22 holding [both high target dates +/-1 were published in advance and were filled at that time significantly by an index or instrument]
Flags will be posted here when a top is detected. (1/25/20, 2/20/20)
This Information Is For Entertainment Purposes Only. Financial Loss Can Occur From Investing.
Our favorite go to site- McVerry Report

Our favorite go to site- McVerry Report


