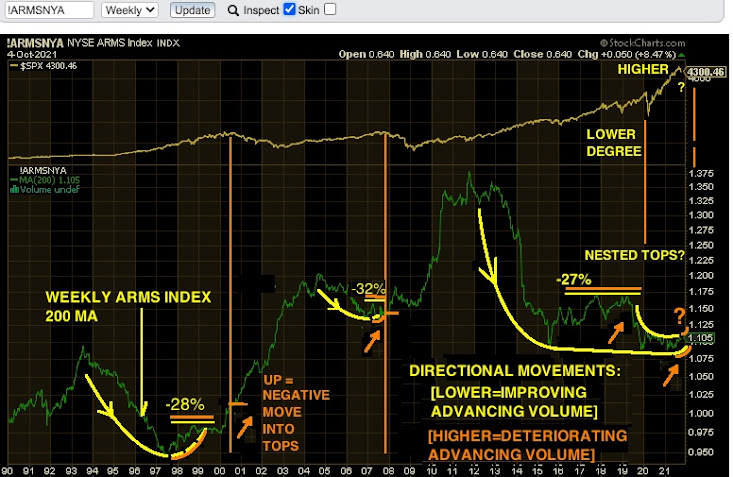
10/5/21: See updated review of ARMS index at bottom. Previous analysis needed a better pattern approach based on movement of it's 200ma. Notice the 27-32% retrace levels create a set-up that precedes significant tops. Also note that the nested lower degree movement entering 2020 hit -34% retrace up into the 2020 top [from the '-27%' position label on down] so this action in the index continues reaping consequences.
Note- ARMS index = (advances / declines) / (advancing volume / declining volume). So: lowering values means a climbing volume ratio [market bullish tendency].
Original post:
EOD: ARMS index turned up +9% after being down -68% in the prior session so there may be an attempt towards a turn signal. Also the low in ES from the prior session has held so far. Some prior gaps in volatility were also double-filled. Prices could very well crawl around for a while as breadth numbers deteriorate to levels more in keeping with a terminal top.
The bots will flag here when they see a top. (1/25/20, 2/20/20)
This Information Is For Entertainment Purposes Only. Financial Loss Can Occur From Investing.
Our favorite go to site- McVerry Report
Monday, October 4, 2021
Waves Down Could Be Close To Completing Pivot Bottoming Phase
Subscribe to:
Post Comments (Atom)


No comments:
Post a Comment