EOD: A small turn signal up in volatility [market down] has printed at the close. It may indicate a retest of the triangle that tried to break up or some other recent low. Alternately it could be a beginning wind up to something larger.
 2:10pm EST: SP-500 has a lower gap it may need to fill. Previous short-term projection still on tap. It has been noticed there's a majority of optimistic outlooks being proposed by analysts. Stay focused on pattern & data analysis. It will either confirm or otherwise. Looks like 50 / 50 presently among many indicators analyzed. A turn signal is often reliable and should call it when it arrives. Still waiting for one.
Original post-
In an attempt to check all additional indicators available and relationships between them in order to gauge the current market situation at all times, the following has been submitted:
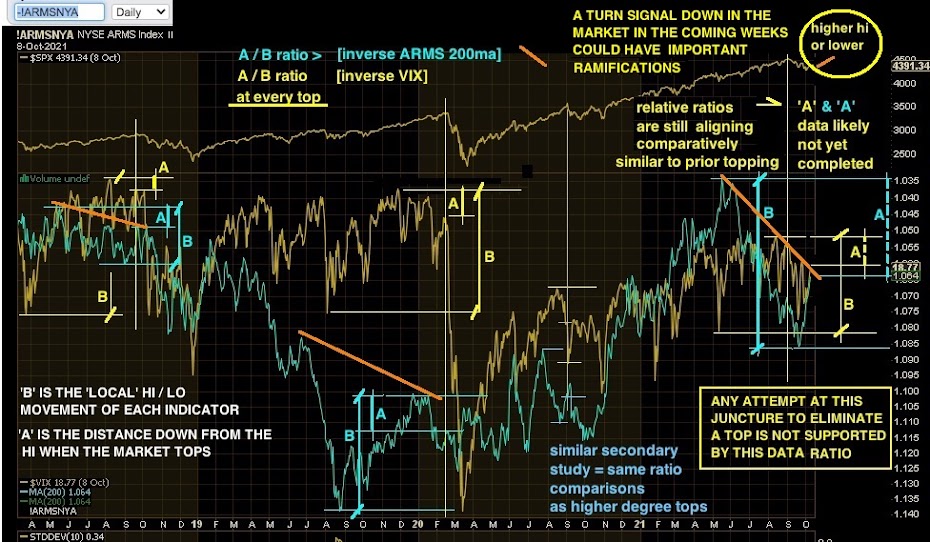
There is an on-going consistency in the ratios between the drop in the *inverse ARMS index 200ma and the drop in the *inverse VIX at major tops. The ratio demonstrates a greater drop in the inverse ARMS 200ma indicator relative to the drop in the inverse VIX. By itself, it does not signal a top but with an advanced market such as the one we have now, it should be of concern. If the inverse ARMS 200ma closes the gap by accelerating high enough to eliminate the established relationship differences seen in previous 'topping' ratios, a new analysis will be presented at that time. An argument could also be made that the inverse ARMS 200ma could be inclined to move higher more in keeping with previous tops as the A / B ratio is currently quite large relatively but it may not be required to do so. A turn signal up near here will most likely support that scenario.
Regardless of the ratio details, the inverse ARMS 200ma orange descending trend line is flashing currently. The study has also been generous to avoid bias by applying the 'A' drops near the recent SP-500 lows rather than at the recent top. If the actual SP-500 high was used, the difference in ratios would be the largest seen by far. A tiny drop in inverse VIX and a huge drop in inverse ARMS 200ma. That would look extremely ominous if it turns out to be the main market index all-time highs. It would mean the indicators have currently commenced moving towards market lows from extremely significant divergences in their ratios that printed at all-time market highs. Let's see where the next turn signals appear for better directional analysis.
*The 'inverse' values were used to simplify the reading compared with market direction.
Note that a secondary study was looked at to verify general consistency in late August 2020 which it did.
The bots will flag here when they see a top. (1/25/20, 2/20/20)
This Information Is For Entertainment Purposes Only. Financial Loss Can Occur From Investing.
Our favorite go to site- McVerry Report
No comments:
Post a Comment