Update- see latest post 3/1/21
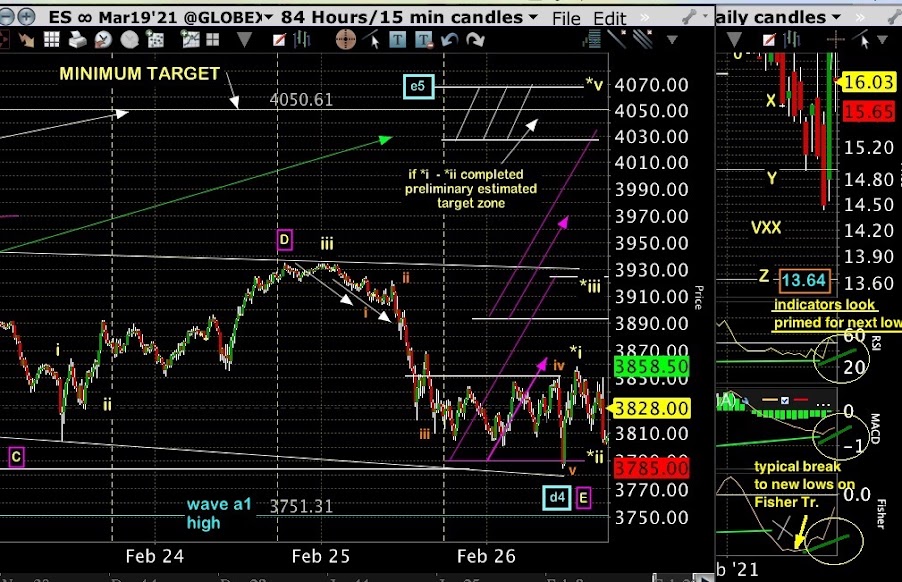
Daily breadth MACD closed slightly up on the histogram which could support the estimated move shown in the chart. The weekly MACD signal line closed slightly down for the fifth consecutive week but may be about to break above zero as the next top prints.
If these alignments are correctly analyzed, including waves ' * i - * ii ' up at the close, then a projection based on typical fib extensions takes us to the target zone shown.
The expected low price zone on VXX should print at that time completing positive daily divergences on all the VXX indicators.
NO CRASH SCENARIO Bottom Chart (weekly) shows why the analysis does not likely support a larger degree top currently. HOWEVER, given the volatility of price moves in the current environment, the next short-ish term top may scare more than a few.
See Critical Long-Term Review Here
The bots will flag here when they see a top. (1/25/20, 2/20/20, 4/9/20)
This Information Is For Entertainment Purposes Only. Financial Loss Can Occur From Investing.
Our favorite go to site- McVerry Repor


Am i understanding the chart/s correctly that the short-ish term top is 3920 and of 1 and 2 are completed TP is 4050?
ReplyDeleteDo you have a timeframe for the 4050? I'm looking for the market to be up Mon-Tues this week but then down into friday.