Saturday, February 27, 2021

All Indicators Primed For Next Market High To Arrive

Update- see latest post 3/1/21

Daily breadth
MACD closed slightly up on the histogram which could support the estimated move shown in the chart. The weekly MACD signal line closed slightly down for the fifth consecutive week but may be about to break above zero as the next top prints.

If these alignments are correctly analyzed, including waves ' * i  - * ii ' up at the close, then a projection based on typical fib extensions takes us to the target zone shown.

The expected low price zone on VXX should print at that time completing positive daily divergences on all the VXX indicators.

NO CRASH SCENARIO Bottom Chart (weekly) shows why the analysis does not likely support a larger degree top currently. HOWEVER, given the volatility of price moves in the current environment, the next short-ish term top may scare more than a few.

See Critical Long-Term Review Here
The bots will flag here when they see a top. (1/25/202/20/204/9/20)
This Information Is For Entertainment Purposes Only. Financial Loss Can Occur From Investing.
Our favorite go to site- McVerry Repor


Friday, February 26, 2021

Potentially Very Positive Outlook After Leg Completes


Technically leg down likely is completed as tiny [i] taken out to the upside but lower range could be retested before close.
Watch 3844.50 for a potential reaction..


Update: 10:12am EST:
3 waves down to 3787.50 zone from 3851.75- may not be done yet.
10:33am: There's our old friend (small one here) 'C-D' rapid wave again- Could be in a tiny wave [iv] up from 3785 low zone

If pattern estimates are accurate, the new structure that is now printing fits the outlook. Minimum estimate- starts at target ES 4040 ZONE after completion down. Expectation would fit if we get another weekly negative breadth print prior to the short-ish terminating top signal at 'E' / 'e5' when it prints.

Followers of this blog will have seen this type of structure many times already particularly where the wave 'C-D' is the fastest and most dramatic move in the build up to an 'E' top.

If 'ai' zone gets taken out to the downside. then this projection will require reviewing.

See Critical 
Long-Term Review Here
The bots will flag here when they see a top. (1/25/202/20/204/9/20)
This Information Is For Entertainment Purposes Only. Financial Loss Can Occur From Investing.
Our favorite go to site- McVerry Repor


Thursday, February 25, 2021

Count-Down Target Still Valid

EOD: Bounce at 3810 zone is a valid measured extension down and most likely sets up a new leg upwards. Wave 'd4' may still need to consolidate before the leg up begins in earnest. Meanwhile breadth is seeing attrition as expected prior to a top of some size.


 Update: 1:01pm EST: 3829 zone is the approximate center line of the expanding diagonal down and may provide short term  resistance at that location. These look like preliminary moves to set it up for the short-ish term top to arrive later on. Keeping an eye on VXX at target 13.64 zone to most likely flag the top in question.

Minor top still in play. Watch VXX price to hit 13.64 zone for next clue. Could go any direction short term at this point. Lower chart is still valid.

See Critical 
Long-Term Review Here
The bots will flag here when they see a top. (1/25/202/20/204/9/20)
This Information Is For Entertainment Purposes Only. Financial Loss Can Occur From Investing.
Our favorite go to site- McVerry Repor
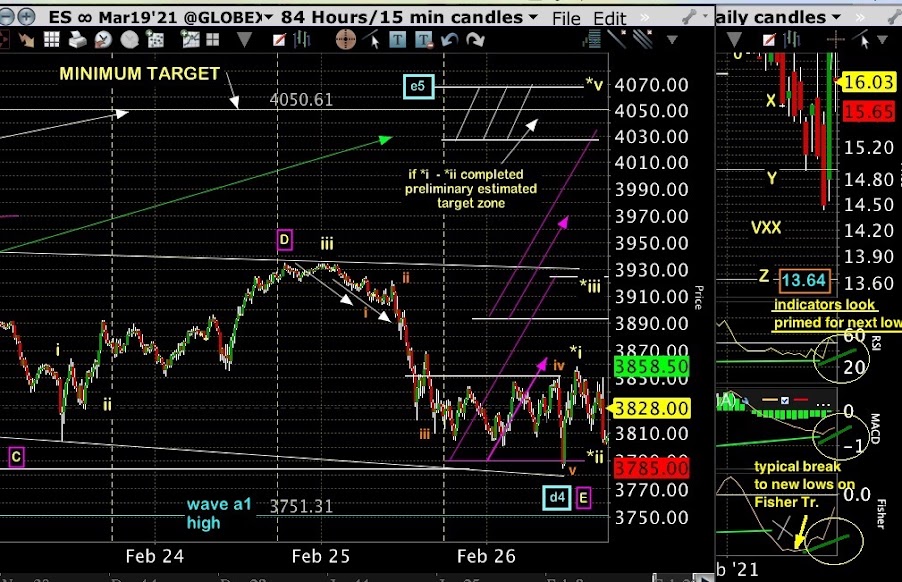
Update 11:11am EST: 3-up and smaller 3 down so far. Yellow 'i' up at 3865 zone could be challenged potentially setting up an inverse right shoulder to drive the market higher for the run in to targets.


Wednesday, February 24, 2021

Structural Pull Back To 'Momentum Top'

Update 12:43pm EST: Nearing a 'Pi-time' intra-day increment as an a-b-c up looks to print with first target approaching at 3918, 3924, 3936 zones.

Original post:
The actual ES futures price where the real downward momentum may commence has yet to print. A VXX price flag at 13.64 zone may be key. Wave 'A' down at 3804 zone looks corrective or may be a double zig-zag and appears to have some intent and strength so far. At this point, the wave labelling is not critical to the expected conclusion. Vectors indicate this potentially will be a minor top. More 'crash' trash talk seems to be here and there which often indicates a mood not conducive to bigger degree tops.

See Critical Long-Term Review Here
The bots will flag here when they see a top. (1/25/202/20/204/9/20)
This Information Is For Entertainment Purposes Only. Financial Loss Can Occur From Investing.
Our favorite go to site- McVerry Repor


Tuesday, February 23, 2021

Minimum Right Shoulder Target Hit- May Go Lower

There are indications the market may go lower prior to wave 'e5' up. Momentum (up) in volatility derivative VXX was approximately at 60% yesterday- anything > 50% usually signals intent to go higher (market goes lower). The 18.0 price zone in VXX may well be attacked before the pending lower target 13.64 expected to complete the structure.

See Critical 
Long-Term Review Here
The bots will flag here when they see a top. (1/25/202/20/204/9/20)
This Information Is For Entertainment Purposes Only. Financial Loss Can Occur From Investing.
Our favorite go to site- McVerry Repor


Monday, February 22, 2021

Two Volatility Triggers Aligning

Volatility derivatives SVXY and VXX most likely need to hit their respective mathematical targets (Z) in order for wave 'd4' to descend with some momentum.

Wave 'c3' has room to hit a small percent above where it was labelled originally per a recheck of the extension calculation applied. The right shoulder identified in prior post remains a valid possibility also.

See Critical 
Long-Term
 Review Here
The bots will flag here when they see a top. (1/25/202/20/204/9/20)
This Information Is For Entertainment Purposes Only. Financial Loss Can Occur From Investing.
Our favorite go to site- McVerry Repor


Saturday, February 20, 2021

Potential Right Shoulder & 4th Weekly Breadth Prints Negative

See New Post Mon Feb 22 2021

Update note:
 The chart comment- "WAVE 5 HIGHER TARGETS BEGIN" is a reference to how far ES futures wave values may have travelled since the low on 3/23/20 (at the ES 3910 zone). This is a minimum point at which the highest degree wave 5 from 3/23/20 low may have hit a length wave5 = length wave1. A price reaction in this zone by itself does not necessarily indicate a larger degree top as the chart notes- an 'e5' is expected which could travel a significant amount higher where we expect a 'TOP' w5 = w1 x fib ext. Only very occasionally does wave5 = wave1 in length so while it is unlikely, it is not impossible and supporting vectors indicate we are getting closer to a 'TOP' where w5 = w1 x fib ext so we need the fib ext to print. 

The diamond target that was hit was 1.27% above 3910.0 at 3960.0 zone and 3910.0 is extremely close to the diamond structure commencing and also it's failure point afterwards which is an interesting observation. This lends more ammunition to the w5 = w1 idea at the 3910 level as a correct statistical analysis since this could produce a notable reaction (pre-topping zone?). Whatever unfolds next could enforce or nix it being wave 5 pre-topping zone. There most likely needs to be several more sessions potentially in a range or new all-time highs where VXX prints it's LOW target. Regardless of where ES is price-wise when VXX hits the low target, we anticipate a market reaction probably down.

Original post:
Regardless of whether there is a right shoulder or not, indications favor a pullback event to form 'd4' as noted. Since 'b2' was a very shallow pullback (just below the bottom of the chart on the left), alternation gives us a shot at a decent size wave 'd4' down.
The key to this event is to watch VXX to see when it prints in the 13.66 zone.

Weekly breadth MACD signal on the NYAD has printed it's fourth weekly negative signal at (-)11.6 which is the highest (less negative) value it has printed in the last four consecutive weeks of negative prints and strongly indicates buying enthusiasm at this level that often predicates a top of some size. We still have to see wave 'e5' up in ES futures later on.

SVXY, in it's fractal we proposed in a previous post, could be nearing it's breakout position to generally match with ES futures 'e5' up. Note that the two volatility derivatives VXX and SVXY can and often do move quite independently of each other and the market index. At VectorSpike there is a detailed multi-pattern recognition system that attempts to keep us focused on turning points aligned with these volatility derivatives.

The chart will be subject to adjustment as unfolding conditions dictate.

See Critical 
Long-Term
 Review Here
The bots will flag here when they see a top. (1/25/202/20/204/9/20)
This Information Is For Entertainment Purposes Only. Financial Loss Can Occur From Investing.
Our favorite go to site- McVerry Repor


Thursday, February 18, 2021

Retrace: Post-Failure Target Projection

'Diamond' short-term continuation pattern failed at it's minimum target ES 3960 zone. A downward structure may be forming. We expect VXX to proceed lower to it's next target prior to a bigger decline in the market commencing. Breadth needs to print more negative numbers as it has gone up very quickly on investor enthusiasm.

CORRECTION ON LOWER CHART 'c4' AT VERY BOTTOM LABEL SHOULD READ 'd4' (light blue border)

11:08am EST: UPDATED CHART PROJECTIONS
If this is a 'd4' pullback, it could take a while to print since it took 12 days to reach 'c3' which would create negative weekly breadth possibly for two weeks including the current one. That would set us up nicely for a bigger top to form.

See Critical Long-Term Review Here
The bots will flag here when they see a top. (1/25/202/20/204/9/20)
This Information Is For Entertainment Purposes Only. Financial Loss Can Occur From Investing.
Our favorite go to site- McVerry Report


Wednesday, February 17, 2021

'Diamond' Breakout Level About To Be Tested

Update 12:30pm EST:  Short-Term Leaning Impulsive Down- Expecting VXX to close the gap and challenge it's low range prior to heading back up as the market continues to decline.


Update 10:31am EST:
FAILURE AT THE DIAMOND! Lower declines on tap. Targets- ES 3865 if yellow 'v' printed and ES 3808 if blue 'c3' is a wave 3 of 3 total). If 'c3' is wave 3 of 5, then a 'd4' pullback will print with a less deep target somewhere above 3808. This decline could take us to Friday week-ending close for a negative weekly breadth print.

VXX is showing 4hr chart strength and VIX volatility is still elevated. The VIX itself may have printed three increasing depth back-to-back capitulation moves prior to the diamond target being touched- that could spell a short-term decline.

See Critical 
Long-Term
 Review Here
The bots will flag here when they see a top. (1/25/202/20/204/9/20)
This Information Is For Entertainment Purposes Only. Financial Loss Can Occur From Investing.
Our favorite go to site- McVerry Report


Tuesday, February 16, 2021

ES Futures 'Diamond' Continuation Target Zone Touched

EOD: Strong bounce off minimum 'diamond' target zone shows some weakness short-term. Breadth showing some daily declines but needs to print a weekly decline to count for anything here. Trend is still positive.

Note that the DOW appears to be lagging the SP-500 but is now trying to catch up. It may be close to a nominal wave 5 first watermark high at 32,308 zone (+2.7% higher = nominal length touch) inside that wave (nominal length wave 5 = length wave 1) which could be an equivalent watermark to the ES 3918 zone shown below in that instrument (chart comment- "higher targets begin"). When they have both hit similar high watermark wave targets (nominal now or optimal later when length wave 5 = wave 1 x fib. factor) , the real fireworks may begin. Not there yet but may be close to a first watermark reaction if there's a wave 5 timing/price confluence imminent between the DOW and SP-500. Could happen this week. Need to see DOW hit 32,308(+) zone to fully catch up. It is currently at fib 76.4% of wave 5 nominal target and that could be a sufficient watermark on the DOW for a short-term reaction.

Overnight- "diamond" breakout was tested a few cents shy of target and held so far.


Update 2:09pm EST:
ES futures hit the minimum 'diamond' target and is now retesting it's breakout from it. While it is overlapping back past the 2/10 -11 highs, it looks like this leg may conclude as a corrective up from here.

original post:
Keeping an eye on 'c3' light blue border at 3971.25 zone CASH for potential short term pullback during pre-topping process... 'c3' could also co-print a small yellow 'v'.  There still is no clear signal on breadth regarding a medium/medium-large degree top so far.

VIX volatility VVIX is still elevated and needs to make lower lows prior to a medium/medium-large top printing so despite potential whip-saws, new all-time highs potentially taking out ES 4010+ need to print. 

"Crash" talk is gradually being replaced by optimism - a good sign for a pending topping process.

On another note: Bitcoin is flying high like there is no end in sight which is another indication of extended investor euphoria. Where does it 'top' ?- we have not done an analysis on it but perhaps we might try to see if there is any discernible structure to it. Quick look see- it could be close to a wave 3 top but it is at length 2.75 x wave 1 from the wave 2 low in Feb 2019 which qualifies as 'extended' so in 'normal' structural terms, there could be a wave 4 pullback pending in the near future and then off to new highs. If it does a 'normal' wave 4 pullback, it could go into the $30,000 price zone before taking off again in a wave 5. It's a dodgy proposition as the chart has gone almost vertical since 12/21/20 and if there are only 3 waves to the structure, there could be a severe collapse. It requires no nerves or those of steel to negotiate this kind of volatility. We like to sleep nights- you can't measure the value in that. Be wary- stress will terminate you as fast as a bullet when applied for long enough and at a sufficient dose. Be disciplined enough to be content with modest 'ok' gains and keep living a life. The current times are particularly nasty already without additional burdens out of our control.

See Critical Long-Term Review Here
The bots will flag here when they see a top. (1/25/202/20/204/9/20)
This Information Is For Entertainment Purposes Only. Financial Loss Can Occur From Investing.
Our favorite go to site- McVerry Report


Saturday, February 13, 2021

Weekly VXX MACD Crosses Up (2nd Week)

Could be close to second pre-top to print in the market (potential small nested wave 3/C top). This is the most likely scenario if weekly VXX MACD print remains above the signal line. Also, the actual MACD print hit a low close to the one prior to the previous top which lends credibility to the overall maturity of the MACD. It could of course decide to buck lower as VVIX volatility of volatility is definitely a prevailing factor in this structure so we will watch this closely.  Since this next move will most likely not be a high degree top, we do not expect a 'quiet' entry like last Feb 2020 so expect some whipsaws. 

VXX is about to close a weekly gap from 2/18-2/24/20. A first long-term target is immediately below this gap in the $14.45 price zone.

An aside note: We have good respect for McClellan Financial Publications who we do not follow but take note of on occasion when warranted. Their recent commentary/analysis meshes with the 'E' top projection shown below estimated to print in the summer of 2021. Coincidence or a parallel confirming analysis? We lean towards the latter of course. This will hold more likely if the 'C-D' leg is an accurate label inside the megaphone outline shown in the $SPX plot just below.

See Critical Long-Term Review Here
The bots will flag here when they see a top. (1/25/202/20/204/9/20)
This Information Is For Entertainment Purposes Only. Financial Loss Can Occur From Investing.
Our favorite go to site- McVerry Report


Friday, February 12, 2021

Short-Term Projections & 3-Month ES Futures Chart

EOD: VIX is demonstrating capitulation down spikes in daily succession which usually preempts a pullback in the market after the next highs show up. The most likely scenarios are for one or more mini-tops prior to the main top occurring later on.

original post:
Bottom chart: Grey Border 'C' was potentially pre-top #1. Pre-Top #2 may be forthcoming (with a smaller/larger drop?) before launching to new highs.

See Critical Long-Term Review Here
The bots will flag here when they see a top. (1/25/202/20/204/9/20)
This Information Is For Entertainment Purposes Only. Financial Loss Can Occur From Investing.
Our favorite go to site- McVerry Report


Thursday, February 11, 2021

Fifth Wave Up Still Valid- ES & SVXY Projected Targets

Update 12:57pm EST: Vectors indicate higher gaps in VXX and lower ones in SVXY need closing (market needs to pullback short term). Than a sling shot to new highs. The pullback could well take several trading days until the new high sling shot occurs.

Fifth wave up ('v') still valid above ES futures 3868.50. 

VIX is about to challenge it's lows from 11/27/20. Breadth is bullish overall. Everything looks aligned for more upside eventually on a weekly basis. We will adjust the outlook as needed.

See Critical 
Long-Term
 Review Here
The bots will flag here when they see a top. (1/25/202/20/204/9/20)
This Information Is For Entertainment Purposes Only. Financial Loss Can Occur From Investing.
Our favorite go to site- McVerry Report


Wednesday, February 10, 2021

Near Term Targets & Medium Term Outlook

Update 10:48am EST: Most likely temporary pullback to fill SVXY gap and then a higher print forthcoming.

Previously published targets are still in focus. Breadth on the daily supports higher targets.

See lower charts for an overview of the medium term using SVXY and SVXY vs SP-500 potential fractal behavior. Note the remarkable similarities between the current pattern now in 2021 and the one in 2019/2020. The scale currently is larger by a factor of about 3.5 :1! Not sure if there will be another deeper pullback like the one that's pre-drawn on the second chart (where noted with '?') before a launch into the next 'topping' or pre-topping pattern.

See Critical Long-Term Review Here
The bots will flag here when they see a top. (1/25/202/20/204/9/20)
This Information Is For Entertainment Purposes Only. Financial Loss Can Occur From Investing.
Our favorite go to site- McVerry Report


Tuesday, February 9, 2021

Potential Pre-Top Printing Targets On Cue

Update: 10:39 an EST: Intra-day breadth is showing some decline so far. VXX has a few recent gaps down so maybe those need to fill before we head off to a new all-time-high.

Breadth is not showing weakness to the extent that a larger top would print however, we are watching the progression to the upper target on ES futures. VXX still needs to take out it's lows through the gap to target B. An expanding diagonal in ES looks to be a possible pattern.

An obvious, deep failure from ES 3913.75 zone would suggest a very nominal wave 'v' (no brackets) at the next degree higher may have occurred otherwise the wave '[iii]' (with brackets) most likely remains valid.

See Critical 
Long-Term
 Review Here
The bots will flag here when they see a top. (1/25/202/20/204/9/20)
This Information Is For Entertainment Purposes Only. Financial Loss Can Occur From Investing.
Our favorite go to site- McVerry Report


Monday, February 8, 2021

Nominal Upper Targets Printing

EOD: HITTING PROJECTED TARGETS:


Note that the 'PRE-TOP' reference typically refers to a penultimate move. A wave 3(C) or other structural pre-top at some degree would fulfill that description and happens that way more often than not. The label id is not as important as the actual structural behavior at this point.

See Critical 
Long-Term
 Review Here
The bots will flag here when they see a top. (1/25/202/20/204/9/20)
This Information Is For Entertainment Purposes Only. Financial Loss Can Occur From Investing.
Our favorite go to site- McVerry Report