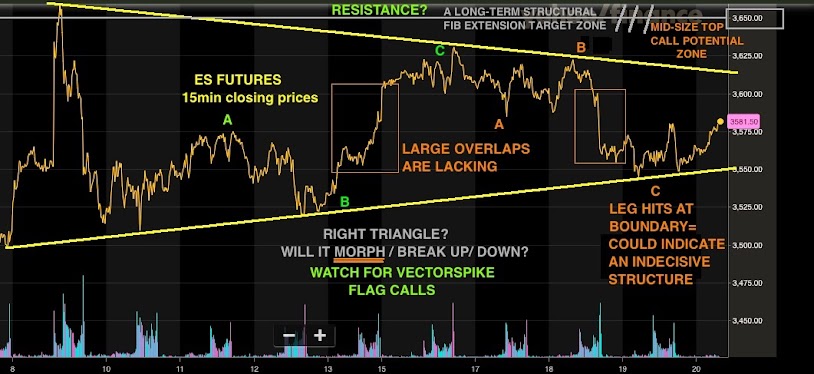
With Friday's down-print- 9 out of the last 12 weeks have printed a down value on the weekly breadth ($NYAD) MACD however, it has been a very gradual moving average signal decline so far. The bottom chart (long right triangle) print continues...note that the closing price down move hits the lower trend line- it may bounce back up or push on the lower trend line.
Watching for hits in the ES and VXX target zones to create an intermediate top.
Lower Chart: May not be what it looks like- it could break partly up and trap a few. However, it may well still be 'under construction'. Don't forget- on SVXY the wave iv up may still be in play and it has now stuck it's head up and is printing new wave iv highs.(wave v down may be pending).
Note the RSI(upper)/Fisher(lower) indicators on VXX daily are printing a consistently rising positive divergence and have been for a few weeks now.
Our favorite go to site- McVerry Report


No comments:
Post a Comment