EOD: With today's down-print- 9 out of the last 12 weeks have printed a down value on the weekly breadth ($NYAD) MACD however, it has been a very gradual moving average signal decline so far. The bottom chart (long right triangle) print continues...

Update: 1:10pm EST: We are passing an intraday 'Pi time' interval, so there could be movement forthcoming. ES 3582 measures as a small wave iii-up from 'b' zone (yellow square) and could be printing a small iv-down now.(5-min candles). Either that or it is done at small wave iii-up.
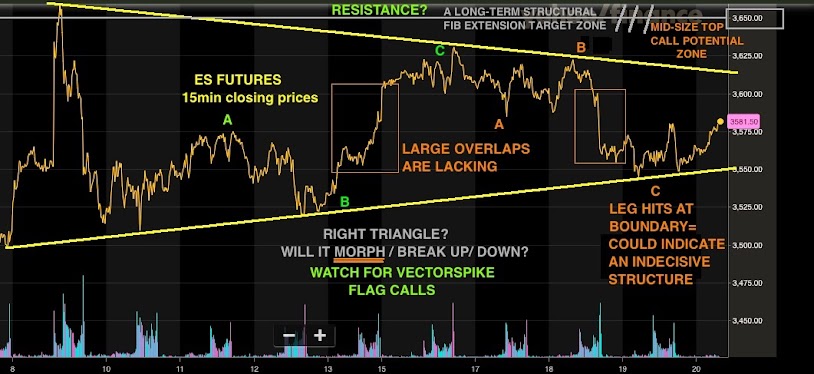
Lower Chart: May not be what it looks like- it could break partly up and trap a few. However, it may well still be 'under construction' so let's see what the week-end in the market gifts us as far as this structure. We are also looking at weekly breadth numbers. Don't forget- on SVXY the wave iv up may still be in play and it has now stuck it's head up and is printing new wave iv highs.(wave v down may be pending)
See Critical Long-Term Review Here
This Information Is For Entertainment Purposes Only. Financial Loss Can Occur From Investing.
Our favorite go to site- McVerry Report


No comments:
Post a Comment