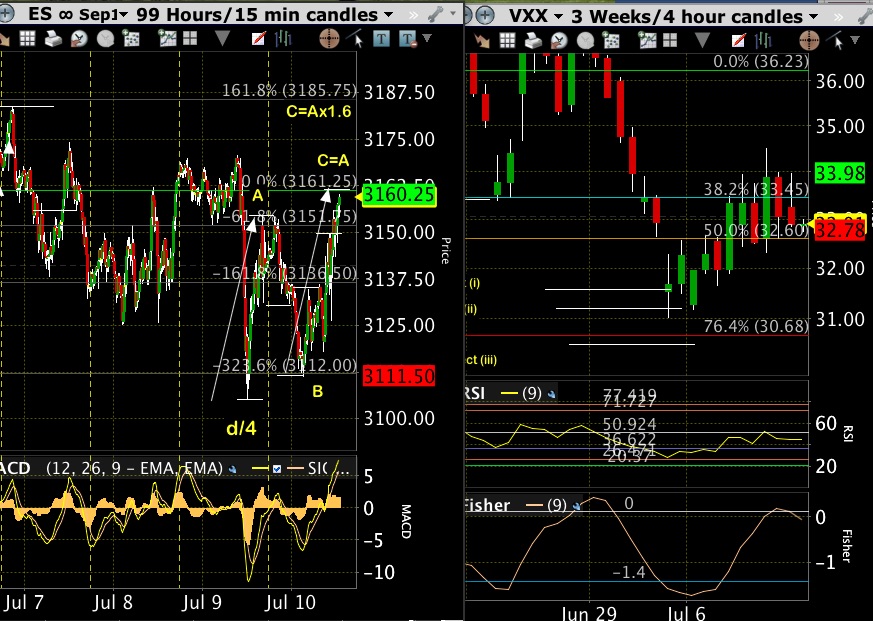
Alternate Projection: The insert on the chart just below (lower right) is from 7/2/20 and shows the VXX fib. projections that may align correctly since the low has held in VXX. The setup would look equally convincing as an alternate at this point except there has not been an upward acceleration in VXX. The proposed megaphone has a valid looking 3-point upper trend line with potentially two more legs (C-D, D-E) yet to print that still leaves room for a
new all-time-high at E giving a Super Cycle Wave 3 'corrective ending' top. Whichever scenario plays out should give a decent sized decline possibly beyond the mid point of the larger megaphone shown on the daily.
EOD: There is a possibility of completion at 3181.25 (purple a-b-c up). There is a daily pattern that we are looking at that will soon be published. There is sufficient evidence pointing to a top zone at today's close. The move up from wave d/4 has not been convincing structurally. It has elements of correction that we ascribed to prices still being in a wave d/4. Zooming out gives us a potential top that could have completed. Check back for the study that is currently being assembled.
Update 1:49pm EST.Looks like our old 'topper' friend Mr. Megaphone could be setting up. Either that or the megaphone fails at the midpoint since VXX seems to be holding it's lows so far relative to ES new highs printing.
Update 12:15pm EST.
Very overlapping potential A-B-C up:
Update 11:07am EST. Nix the h&s via the right triangle for now. Overlapping structure is printing and we just saw another vector signal similar to earlier ones at VXX 31.0 zone so let's see if that prints one of 3 signals that then provides a resistance zone to VXX going lower and/or the market going higher.
Original post:
At VectorSpike 'conventional' stock price patterns are not normally anything we care to indulge which is why we avoid them. The success rate is less than our criteria success rate. Not wishing to ever throw the baby out with the bathwater- it does look to a pattern observer that a head-and-shoulders with a triangle right shoulder may be printing. Right shoulder contracting triangle patterns can indicate a decline environment is about to occur. Equal weight can be given to still being in wave d/4. Daily breadth is attempting to find upward traction but is below it's morning high number so far.
1918 Pandemic Did Not Tank The Market!
See Critical Long-Term Review Here
Forget the 'news cycle'- we report on what is actually happening in the majority trading environment
..and possible bounces/bottoms: (2/28/20) , (3/23/20)
This Information Is For Entertainment Purposes Only. Financial Loss Can Occur From Investing.


No comments:
Post a Comment