Monday, March 22, 2021

Likely Small Wave 'iv' Up Targets

EOD: Ultimately, we have not yet hit the expected highs for the larger degree leg. The expected mid-channel pullback may not happen. Moves are accelerating in both directions. Patience is required.

See Critical Long-Term Review Here
The bots will flag here when they see a top. (1/25/20, 2/20/20, 4/9/20)
This Information Is For Entertainment Purposes Only. Financial Loss Can Occur From Investing.
Our favorite go to site- McVerry Report


Saturday, March 20, 2021

Weekend Projection Update

See Monday update 3/22/21

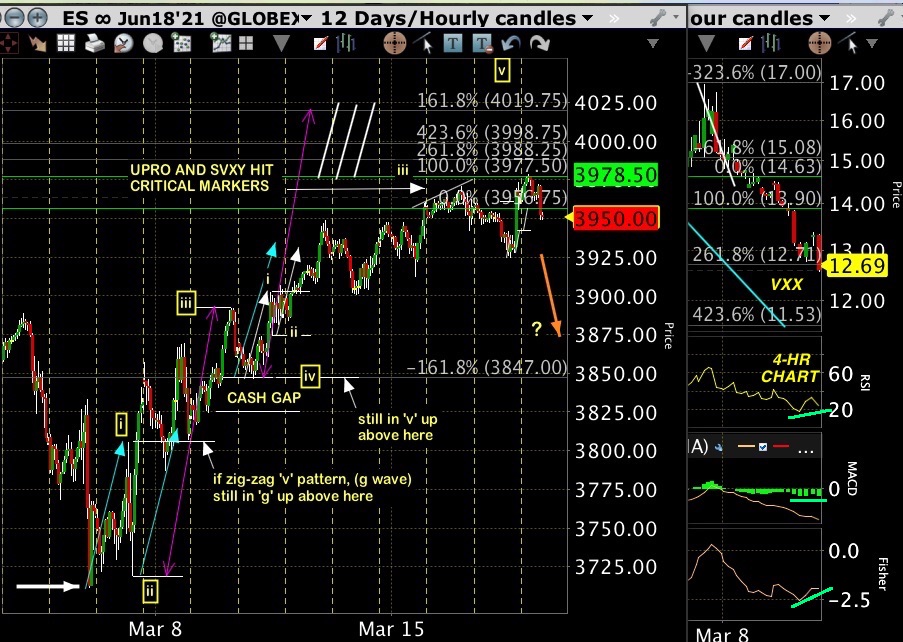
Waves look like more action is needed to complete then expect a retrace perhaps even new highs when we see a daily positive divergence on NYAD MACD. Currently it has not printed the minimum for a meaningful bottom. The leg from March 4 low still has room for a high to print above the current (ES > 3978.50). There is a cash gap between 3825 and 3850 roughly that could be an attractant.

Lower Chart is a current overview. Wave labels have been updated. Note UPRO and SVXY price 'inversion'. This is not usual and posits possibly much lower prices to come eventually for SVXY. Then it should recover towards outperforming UPRO. That could be a long way off given the very long term patterns and could indicate a 'second wave' of lower prices for SVXY after the next lows then retrace up. We appear to be already in an area of major correction not seen for a few generations. Expanding patterns will keep printing new highs and deep pullbacks until the big one arrives later on.

See Critical Long-Term
 Review Here
The bots will flag here when they see a top. (1/25/20, 2/20/20, 4/9/20)
This Information Is For Entertainment Purposes Only. Financial Loss Can Occur From Investing.
Our favorite go to site- McVerry Report


Friday, March 19, 2021

Not Out Of The Woods Short Term But Higher Targets Loom

EOD: Need to wait for more positive daily divergence on NYAD MACD to verify a bottom on daily close- looks small so far. Prefer it to hit -200 both histo and print or at least the MACD print and then move up on closing prices moving down. Not there yet so still not a reliable signal. As noted below, wave 'iv' was retested at 3919 and moved down from there into the close.

Update: 10:47 am EST:
 3874.75 +/- price zone is a 2.6 fib target down from wave 'iii' first pullback into wave 'iv'. Need to see how today (weekly) closes. Next lower target extensions are at 3869 and 3858 but the latter is a fib 4.2 extension and would be unusual but not impossible. If a retest of wave 'iv' is occurring, targets could be between 3906 - 3919 +/- 


Original morning post:
Could possibly label as an expanding wave 4 down pre-open. A 
pullback to mid-channel on the daily could be expected soon
before much higher targets (see bottom daily chart from 3/16), A short-term bullish aspect could keep printing at or above recent highs first. Current action may be the preliminary stages towards a mid-channel pullback as daily breadth is heading down and has been for 5 consecutive trading days while prices went up and/or held near the recent highs (one small tick down 3/18) on daily closings (negative divergence). Note that recent larger fib extension high targets printed on UPRO (3/16) followed by one on SVXY (3/17) and those likely will facilitate a mid-channel pullback at some point.

Watching VXX level 12.32 for potential short-term reaction. Ultimately much lower targets are expected on VXX (10.13 nominal low, typically optimum low=10% below that). Not there yet.

Time to call the leg since March 2020 'the mother of all zig-zags'...

See Critical Long-Term
 Review Here
The bots will flag here when they see a top. (1/25/20, 2/20/20, 4/9/20)
This Information Is For Entertainment Purposes Only. Financial Loss Can Occur From Investing.
Our favorite go to site- McVerry Report


Thursday, March 18, 2021

Potential Pull Back Short Term

Update 1:16pm EST: Possibly our old friend "gobs o' zig-zags" now shooting to re-test the top at 3977 (next target 3985) zone. If VXX descends to 12.32 meanwhile, that has the potential to trigger a descent once it's hit. Zig-zags are a roller-coaster ride and staying focused on overriding vectors is critical including lots of daily grind checking fib values is essential.

Update: 11:27am EST: 
 Measures likely [5] waves down to ES 3931 but it is above yesterdays futures low. No convincing decline so far with room for VIX to go lower so let's see if another high is printed in ES. Zig-zagging as expected in this environment until it gets to where it wants to be.

original post:
Watching to see if ES price zone 3975+/- (3988+/- so far overnight) creates a reaction. UPRO hit a critical medium term extension March 16 and SVXY a similar labeled extension March 17- both look like wave 3's in conventional impulsive terms. In a potential 'g' up leg, (bottom chart) these could be a smaller 'a' up with a 'b' pullback to follow. Than a 'c' leg towards a 'top' zone. The 'g' leg on a daily closing basis looks like an even smaller a-b-c up already and a total move as big as the original large 'A' take off at the beginning of the leg. This may help to confirm we are in the midst of the terminating leg based on size alone.

Tip: When ES (cash) : VXX = -1% : +6% ratio [over say, two days approximately]- that usually indicates downward market momentum has begun especially when a few other levels are aligned like multiple days (3-4) breadth negative divergence that also printed a new market high. Currently pre-open (9:10am EST) the ratio is -1% : +3% so not there yet- let's see what the cash market shows us by close today / tomorrow.

Daily breadth may have peaked short term and the NYAD MACD is showing a negative divergence on the fourth daily decline vs. daily closing on SP-500. The MACD print has also crossed just below the red signal line for the two last days with both in overall positive territory so room to go lower.

Note that VXX 10.13 is a prime candidate for FIRST LANDING vector target in the seven-wave corrective scenario (a-g). Final destination tends to hit lower by 10% or more.

NOTE THE DRAMATIC DROP IN EARLY 2018 FOR SVXY THAT HAS NOT YET RECOVERED EVEN THOUGH IT HAS 'MIMICKED' WAVES IN UPRO (AND THE GENERAL MARKET). IT STILL REMAINS 'INVERTED' VS UPRO. IN 'NORMAL MARKETS, IT OUT-PERFORMS UPRO. EVEN WITH THE LOWERED LEVERAGE VARIABLE INSTALLED AFTER THE 2018 DROP, IT REMAINS EXCESSIVELY ATTENUATED. THIS COULD BE A BIG NEGATIVE FOR VERY LONG TERM (MONTHLY CLOSINGS) MARKET ACTION UNLESS WE ARE WAY OFF BASE.

See Critical Long-Term
 Review Here
The bots will flag here when they see a top. (1/25/20, 2/20/20, 4/9/20)
This Information Is For Entertainment Purposes Only. Financial Loss Can Occur From Investing.
Our favorite go to site- McVerry Report


Tuesday, March 16, 2021

Much Higher Targets In Focus Short Term

Update: 2:54pm EST: Watching to see if ES price zone 3975+/- (3981 so far overnight) creates a reaction. UPRO hit a critical medium term extension March 16 and SVXY a similar labeled extension today- both look like wave 3's in conventional impulsive terms. In a potential 'g' up leg, these could be a smaller 'a' up with a 'b' pullback to follow. Than a 'c' leg towards a 'top' zone. The 'g' leg on a daily closing basis looks like an even smaller a-b-c up already and a total move as big as the original large 'A' take off at the beginning of the leg. This may help to confirm we are in the midst of the terminating leg based on size alone.

Note that VXX 10.13 is a prime candidate for FIRST LANDING vector target in the seven-wave corrective scenario (a-g). Final destination tends to hit lower by 10% or more.

See Critical Long-Term
 Review Here
The bots will flag here when they see a top. (1/25/20, 2/20/20, 4/9/20)
This Information Is For Entertainment Purposes Only. Financial Loss Can Occur From Investing.
Our favorite go to site- McVerry Report


Monday, March 15, 2021

New Target Zones Approaching

Update: 10:17 am EST: Watching ES 3975 zone (Jun 18 2021 futures) for a possible reaction. We are also on a third pair of down vectors in VIX beginning 3/4/21 and that could tip a short term reversal near VIX 19.47 zone. So far, breadth is going negative (daily short term) while SP-500 making new highs = small negative divergence that may also support a modest pullback soon.

original post:
After rechecking target vectors on daily plots, it is apparent that targets in VXX were lacking. That is now adjusted. It is still likely that we are in a 7-wave corrective from August/Sep 2020 and the target zone for that could be at ES 4044 using preliminary target calculations based on current moves. UPRO did hit 90.00 as was projected so there could be a minimal pullback near here. 

See Critical Long-Term
 Review Here
The bots will flag here when they see a top. (1/25/20, 2/20/20, 4/9/20)
This Information Is For Entertainment Purposes Only. Financial Loss Can Occur From Investing.
Our favorite go to site- McVerry Report


Friday, March 12, 2021

Within Striking Distance Of Long Awaited Target

Review Update 3/13/21: Taking another look at the pattern progression around UPRO / SVXY responses- there is a potential for a medium degree top to print sooner than we anticipated. What is under review is whether we are more likely closer to a wave 5 conclusion (yellow border) rather than the projection at ES 4400 zone. Check back for more on that potential.

Additional study- Observations have often indicated that leveraged instruments that do not suffer from large decays or extreme amplifications can frequently indicate clear intent in price pattern progressions. In our eagerness to count everything as impulsive in the current leg, we now see cause to question that approach. See very bottom chart for more details. Note that pattern indications support a seven wave corrective leg 'a' - 'g' about to conclude with 'g'.

original post:
Minor top could print as VXX enters 13.46 price zone. Either way it gets there should not be an issue. Using the leveraged instrument UPRO often provides a reliable 'tell' and the 90.04 price zone is a strong candidate for that critical level. Based on the size of the down leg, the lower gaps shown are within 'normal' fibonacci extension distances assuming the potential retrace is nothing more than that.

The label  on the chart - 'LG 2.6 FM W2 LO' at 90.04 zone refers to this target level as a long fib (0 origin, -1.6 bottom , +2.6 top) extension calculation ratio from the wave 2 low price (-1.6) in April 2020. That ratio combination is frequently assigned to predict target levels especially ones that are extended such as the leveraged targets we see with UPRO so that zone will be watched  for a reaction whenever it hits together with VXX low target preferably. Subject to live adjustment as necessary.

Orange arrow route will cause VXX (volatility) to rise and perhaps close gaps shown in UPRO. After that VXX may promptly descend to hit the low target as UPRO hits an upper target- (perhaps 90.04 zone which should be a strong attractant). Preferably there will be a daily negative divergence on NYAD MACD which is lacking currently.

(the following paragraph now has an alternate analysis that may supersede this- see first two paragraphs at top together with the very bottom charts)
Second chart is a reminder where we could be medium term using ES futures daily projection. If the analysis is correct, a high degree wave 5 (yellow border) could be where we are and within that, it could still be printing an expanding wave 4 (brown border). Interestingly- pattern action in a wave 5 can often zig zag until it reaches it's target and can appear similarly to a wave 4 in it's overlapping tendencies. This is often the nature of final action in a leg at any degree which could be a result of sellers exiting and late buyers entering less decisively. Whatever the underlying reason, we have observed this to be the case in a wave 5 more than half the time so an expanding wave 4 (brown border) that prints below wave 1 (brown border) top is entirely acceptable although probably not to a purist labeler.

See Critical Long-Term Review Here
The bots will flag here when they see a top. (1/25/20, 2/20/20, 4/9/20)
This Information Is For Entertainment Purposes Only. Financial Loss Can Occur From Investing.
Our favorite go to site- McVerry Report