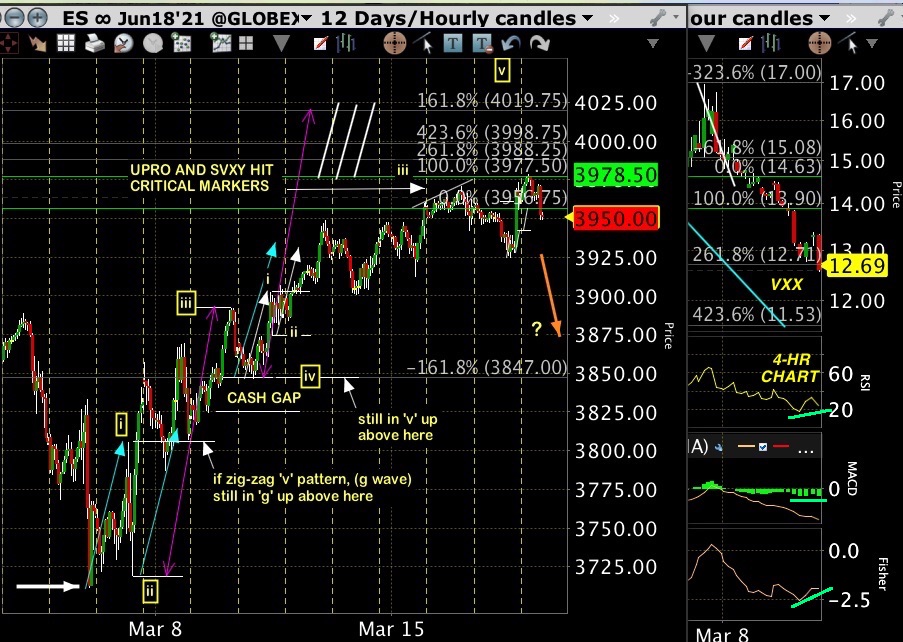
Update 1:16pm EST: Possibly our old friend "gobs o' zig-zags" now shooting to re-test the top at 3977 (next target 3985) zone. If VXX descends to 12.32 meanwhile, that has the potential to trigger a descent once it's hit. Zig-zags are a roller-coaster ride and staying focused on overriding vectors is critical including lots of daily grind checking fib values is essential.
Update: 11:27am EST: Measures likely [5] waves down to ES 3931 but it is above yesterdays futures low. No convincing decline so far with room for VIX to go lower so let's see if another high is printed in ES. Zig-zagging as expected in this environment until it gets to where it wants to be.
original post:
Watching to see if ES price zone 3975+/- (3988+/- so far overnight) creates a reaction. UPRO hit a critical medium term extension March 16 and SVXY a similar labeled extension March 17- both look like wave 3's in conventional impulsive terms. In a potential 'g' up leg, (bottom chart) these could be a smaller 'a' up with a 'b' pullback to follow. Than a 'c' leg towards a 'top' zone. The 'g' leg on a daily closing basis looks like an even smaller a-b-c up already and a total move as big as the original large 'A' take off at the beginning of the leg. This may help to confirm we are in the midst of the terminating leg based on size alone.
Tip: When ES (cash) : VXX = -1% : +6% ratio [over say, two days approximately]- that usually indicates downward market momentum has begun especially when a few other levels are aligned like multiple days (3-4) breadth negative divergence that also printed a new market high. Currently pre-open (9:10am EST) the ratio is -1% : +3% so not there yet- let's see what the cash market shows us by close today / tomorrow.
Daily breadth may have peaked short term and the NYAD MACD is showing a negative divergence on the fourth daily decline vs. daily closing on SP-500. The MACD print has also crossed just below the red signal line for the two last days with both in overall positive territory so room to go lower.
Note that VXX 10.13 is a prime candidate for FIRST LANDING vector target in the seven-wave corrective scenario (a-g). Final destination tends to hit lower by 10% or more.
NOTE THE DRAMATIC DROP IN EARLY 2018 FOR SVXY THAT HAS NOT YET RECOVERED EVEN THOUGH IT HAS 'MIMICKED' WAVES IN UPRO (AND THE GENERAL MARKET). IT STILL REMAINS 'INVERTED' VS UPRO. IN 'NORMAL MARKETS, IT OUT-PERFORMS UPRO. EVEN WITH THE LOWERED LEVERAGE VARIABLE INSTALLED AFTER THE 2018 DROP, IT REMAINS EXCESSIVELY ATTENUATED. THIS COULD BE A BIG NEGATIVE FOR VERY LONG TERM (MONTHLY CLOSINGS) MARKET ACTION UNLESS WE ARE WAY OFF BASE.
See Critical Long-Term Review Here
The bots will flag here when they see a top. (1/25/20, 2/20/20, 4/9/20)
This Information Is For Entertainment Purposes Only. Financial Loss Can Occur From Investing.
Our favorite go to site- McVerry Report


No comments:
Post a Comment