Be sure to read prior post here.
3:55pm EST: Odds are increasing for a decline to begin soon as we move into the week ending [and through to next week?] without taking out the current VXX target low. There is room for a little more market upside to print thereby challenging VXX lows as that would create better form for the decline to begin. It is not required however. After that decline, a new ath should print a terminal top.
11:07 am EST: On 6/1/2021 there was an overnight high ES 4230 that may require the cash market to challenge / meet or exceed or it could just be filling the ES gap down before continuing to pullback to a wave 'iv' bottom target.
Lower chart is current ES wave 'iv' pullback scenario.
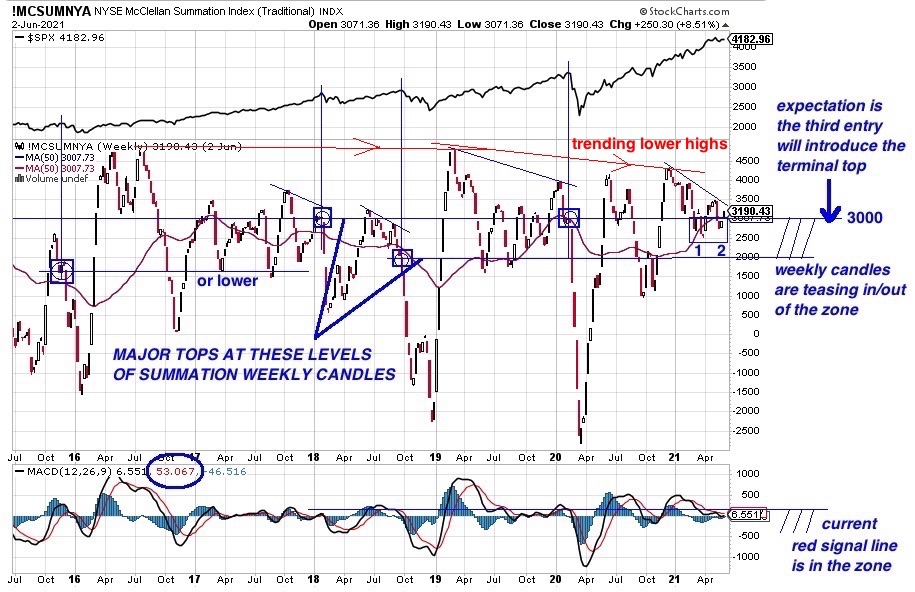
Upper chart is weekly summation candles -[not the 50ma plot but an adjunct to it] demonstrating a critical target zone and supporting the expectation of an approaching top. Originally posted on 2/14/2021 at which time the candles were above the target zones.
See Critical Long-Term UPDATED 4/12/2021 Review Here
The bots will flag here when they see a top. (1/25/20, 2/20/20, 4/9/20)
This Information Is For Entertainment Purposes Only. Financial Loss Can Occur From Investing.
Our favorite go to site- McVerry Report
Thursday, June 3, 2021
At Best- Wave 'iv' Pullback: Targets
Subscribe to:
Post Comments (Atom)


SPX and DOW summation index has not rolled over yet. Potentially that can be the reason for extension.
ReplyDeleteVarun: Thank you for the observation. That is a distinct possibility as the various indexes usually need to catch up with each other. Also, if you notice the latest post shows that the weekly summation candles in NYSE are still sitting above the target zone at 3000 level which also leaves room for a deeper rollover to confirm that the topping action is completing. Stuart.
ReplyDelete