Chart 1- Certainly looks corrective so far. If it turns impulsive, it could have even larger downside implications. Any ambiguity over the wave labelling only reinforces the idea of a wave 4. Wave 4's can typically be slightly confusing. Also the inverse VIX derivative SVXY (chart 4: upwards moves = market bullish) which we have used before to reference has not shown any where near the retrace that the main indices have. This often indicates that it has more downside to go prior to any real bottom occurring. If a 'C' leg is underway, it could print a 3-down wave structure which c-waves often do. The vector turn signals should keep the print on track.
There also exists a very real possibility that SVXY does break low enough to cause a massive upward rebound in market indices towards a new high (S&P 3500 zone has been mentioned). This then could be the market high that represents a multi-year top. This would be the final high of the finishing corrective portion of wave 3 (not the 'usual' finish of a wave 3 but can and does happen). SVXY will possibly still not have reached it's final bottom but will have retraced upwards enough to cause an even bigger collapse down when the market tops at 3500 zone taking the market with it to the bottom of super cycle wave 4. It could take a few years to complete. The good news is that a huge multi-year wave 5 up should ensue. Hope we are all around to see that.
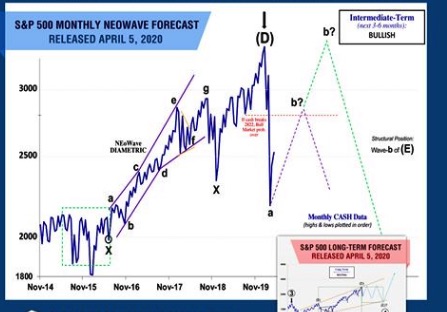
Note that Glenn Neely shows a monthly price pattern that does show a possible turn down about where we are currently. He also has a second alternate at a higher price before it turns down. We only use Glenn's forecasts for reference as our vector signals prove very reliable regarding turns particularly at price highs. There could of course be multiple highs and lows at lesser degrees before the highest degree move occurs. By responding to the better vector signals, we are fairly certain of catching the highest degree move when it does arrive (exiting the lesser degree moves when they turn). Wash, rinse, repeat.
Chart 1 forecast below was created prior to referencing Glenn's latest (chart 2) as we work independently but are highly respective of other work being done by reliable analysts. Similarly, we do reference Martin Armstrong's groundbreaking work regarding cycles based on the Pi constant. Neither of these analysts have exceeded the VectorSpike signals so far however, but they have helped to add support regarding the overall projected market situation.
To get a better overall perspective potential on the wave progression click 'long term review' below-
See Critical Long-Term Review Here
Chart 3 shows any number of ways the new all-time wave 3 (corrective high) could occur prior to a multi-year down move. It is the weekly advance-decline ($nyad) MACD. The vector turn signals will tell us where to change direction.
Chart 4 shows how little SVXY has recovered which is a huge red flag. Volatility is intimately connected to price moves of course so looking at both together gives a more complete picture of what might be projected moving forward.
See Important Long-Term VIX Study
..and possible bounces/bottoms: (2/28/20) , (3/23/20)
This Information Is For Entertainment Purposes Only. Financial Loss Can Occur From Investing.


No comments:
Post a Comment